Spatially embedded recurrent neural networks reveal widespread links between structural and functional neuroscience findings
Received: 12 January 2023
Accepted: 26 September 2023
Published online: 20 November 2023
Check for updates
Jascha Achterberg, Danyal Akarca, D. J. Strouse, John Duncan & Duncan E. Astle
Brain networks exist within the confines of resource limitations. As a result, a brain network must overcome the metabolic costs of growing and sustaining the network within its physical space, while simultaneously implementing its required information processing. Here, to observe the effect of these processes, we introduce the spatially embedded recurrent neural network (seRNN). seRNNs learn basic task-related inferences while existing within a three-dimensional Euclidean space, where the communication of constituent neurons is constrained by a sparse connectome. We find that seRNNs converge on structural and functional features that are also commonly found in primate cerebral cortices. Specifically, they converge on solving inferences using modular small-world networks, in which functionally similar units spatially configure themselves to utilize an energetically efficient mixed-selective code. Because these features emerge in unison, seRNNs reveal how many common structural and functional brain motifs are strongly intertwined and can be attributed to basic biological optimization processes. seRNNs incorporate biophysical constraints within a fully artificial system and can serve as a bridge between structural and functional research communities to move neuroscientific understanding forwards.
As they develop, brain networks learn to achieve objectives, from simple functions such as autonomic regulation, to higher-order processes such as solving problems. Many stereotypical features of networks are downstream consequences of resolving challenges and trade-offs they face, across their lifetime
Our understanding of how the brain’s structure and function interact largely comes from observing differences in brain structure, such as across individuals 1 or following brain injury 2, and then systematically linking these differences to brain function or behavioural outcomes. But how do these relationships between structure, function and behaviour emerge in the first place? To address this question, we need to be able to manipulate experimentally how neural networks form, as they learn to achieve behavioural objectives, to establish the causality of these relationships. Computational models allow us to do this 3. They have shown that network modularity can arise through the spatial cost
Article https://doi.org/10.1038/s42256-023-00748-9
of growing a network4, how orthogonal population dynamics can arise purely through optimizing task performance5 and how predictive coding can arise through limiting a brain’s energy usage6. But we have yet to incorporate both the brain’s anatomy and the brain’s function into a single coherent model, allowing a network to dynamically trade-off its different structural, functional and behavioural objectives in real time.
To achieve this, we introduce spatially embedded recurrent neural networks (seRNNs). An seRNN is optimized to solve a task, making decisions to achieve functional goals. However, as it learns to achieve these goals and to optimize its behavioural performance, its constituent neurons face the kind of resource constraints experienced within biological networks. Neurons must balance their finite resources to grow or prune connections, while the cost of a connection is proportional to its length in three-dimensional (3D) Euclidean space
Results
Spatially embedded recurrent neural networks
Our first goal was to create a supervised optimization process that subjects recurrent neural networks
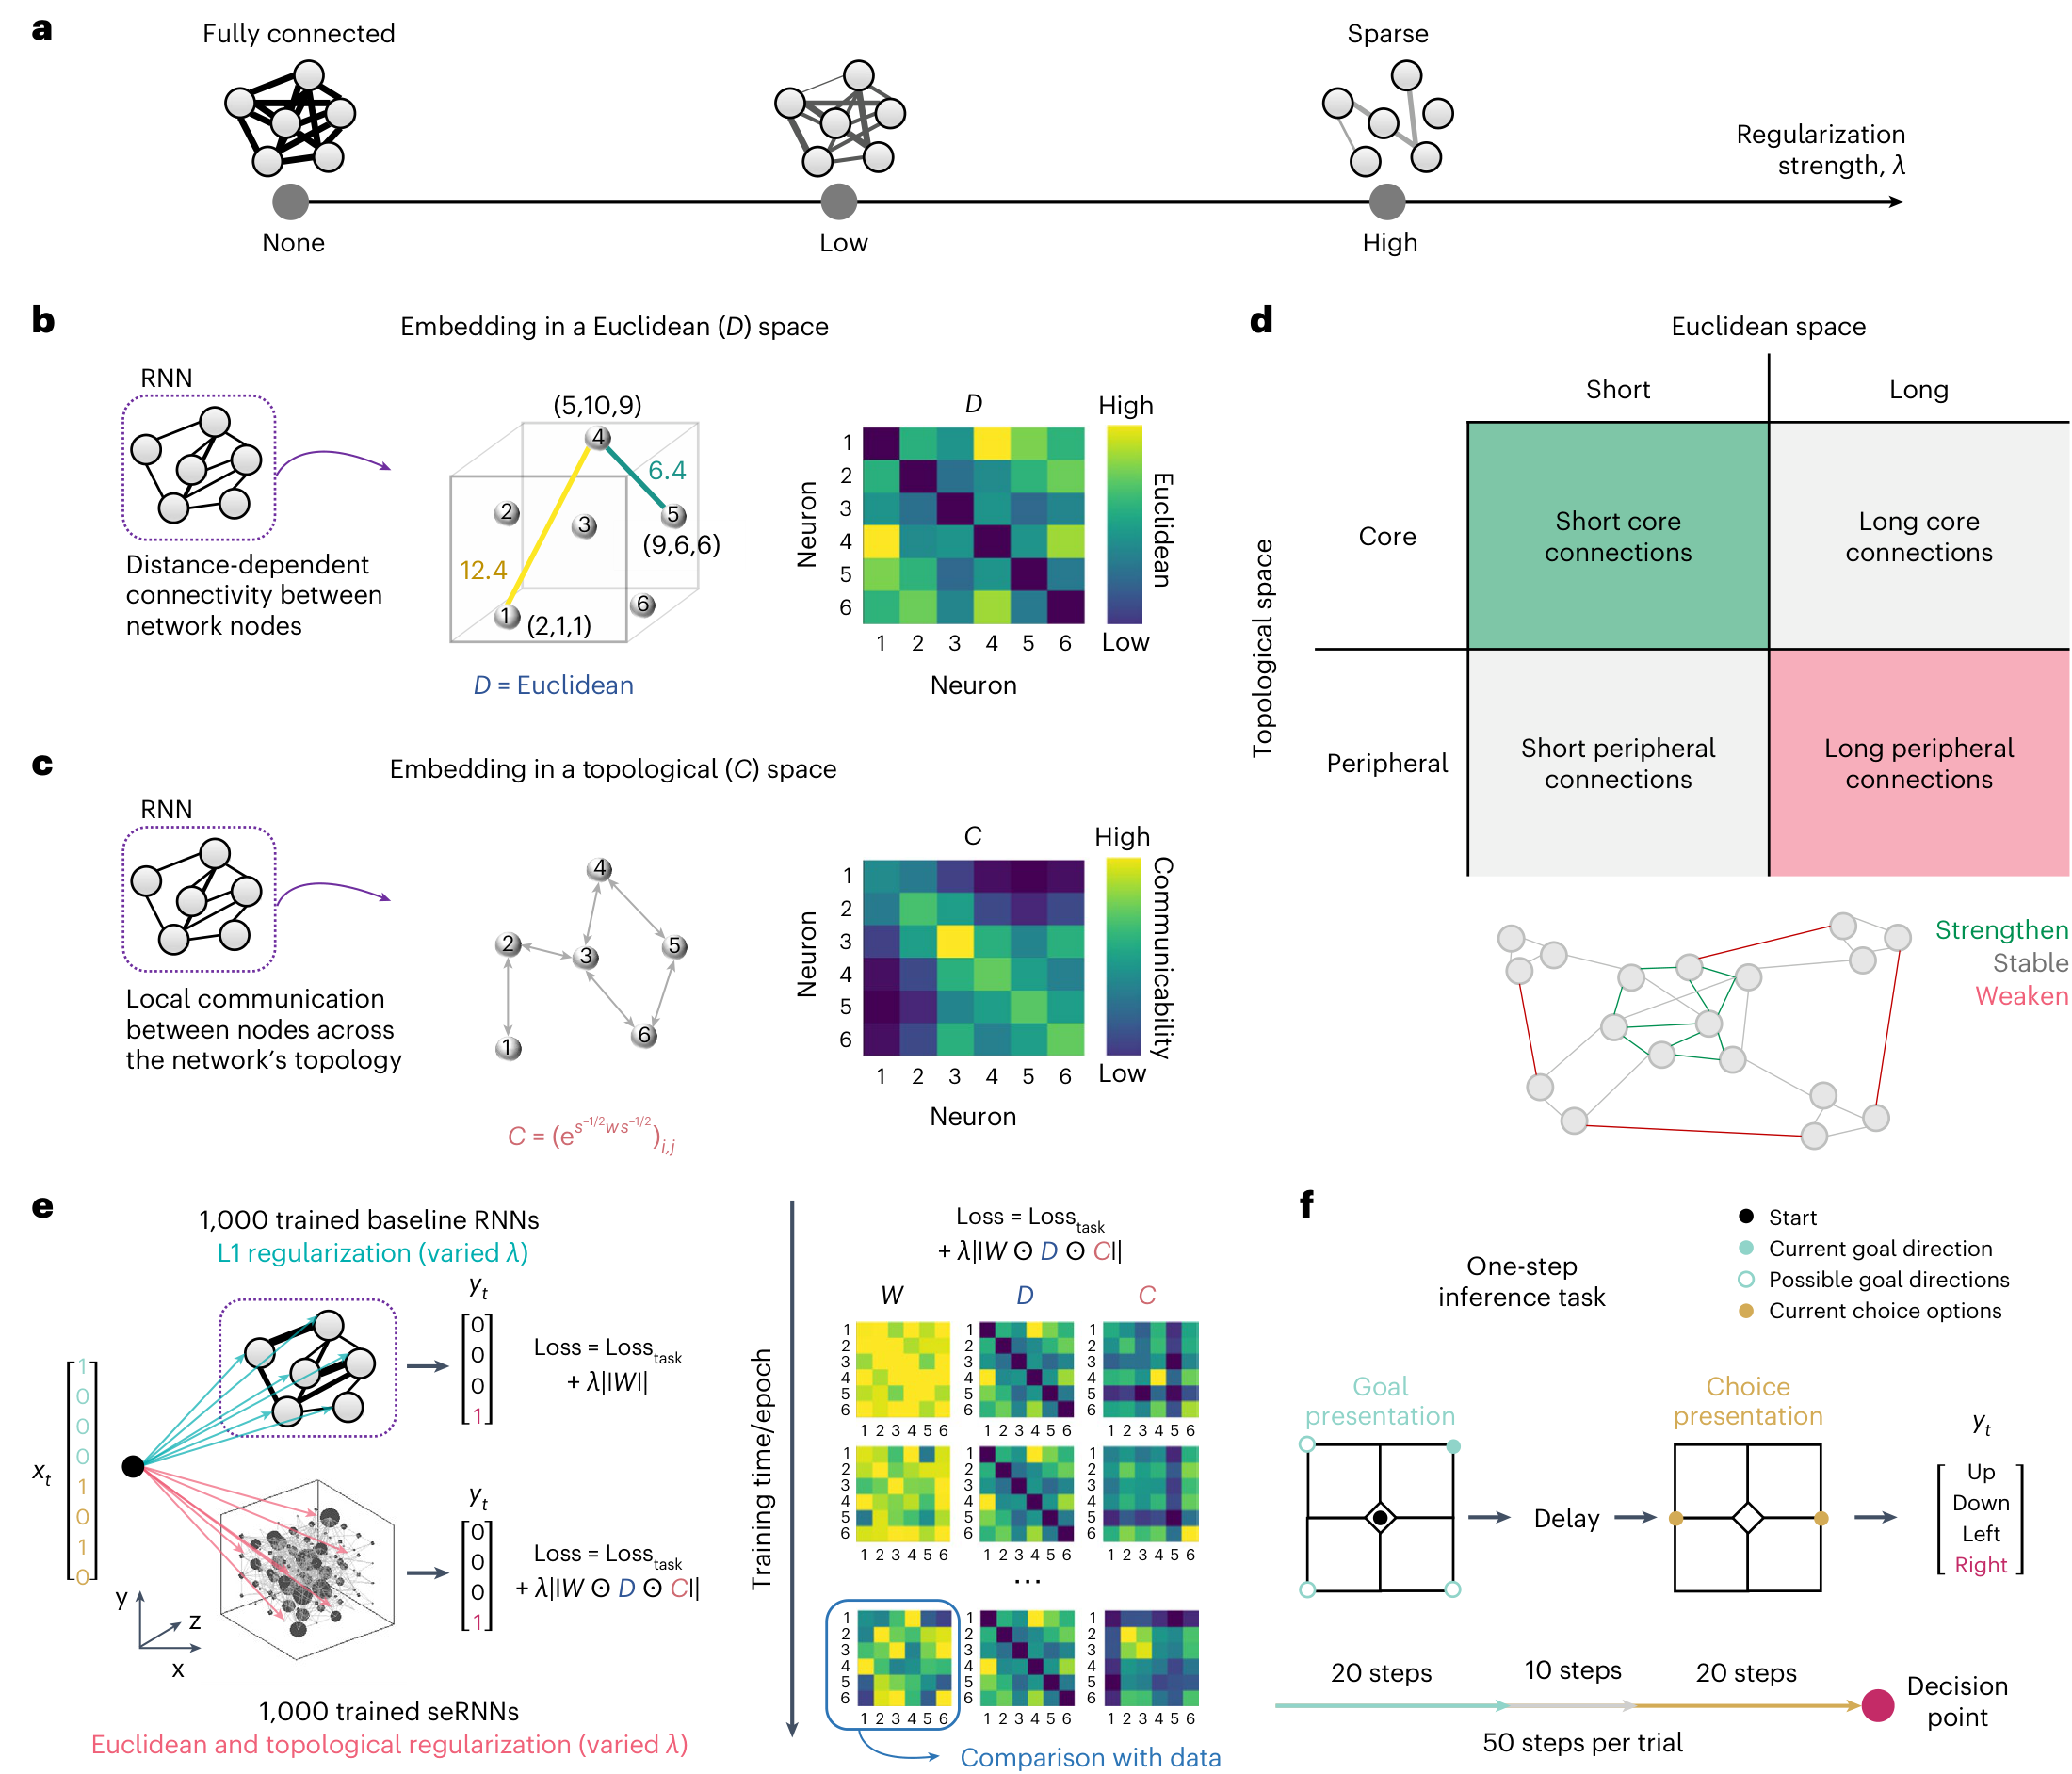
In regularization, instead of merely optimizing a network’s weights to maximize task performance, one adds an additional regularization term to the optimizer to minimize the strength of a network’s weights. This is related to regularized regression, such as L1 (LASSO) regression, where the sum of the absolute beta weights is minimized to improve a model’s out-of-sample prediction performance. We use the same idea to spatially embed an RNN. We start with fully connected RNNs and while they are trained to maximize task performance, we nudge them to minimize weights that are long in 3D space. To achieve this, we assign every unit in the RNN’s recurrent layer a location in 3D space (Fig. 1b) and regularize a weight more strongly if it belongs to two units that are far apart in Euclidean space. In this pruning process, we also want the network to optimize within-network communication, meaning a weight should be more readily pruned if it does not contribute strongly to the propagation of signals within the network. A standard measure of signal propagation in a (binary) network is communicability, reflecting the shortest routes between all pairs of nodes7 (Fig. 1c; see details in ‘Communicability’ in Supplementary Information). When adapted for a weighted network
learns to solve a task, we arrive at seRNNs
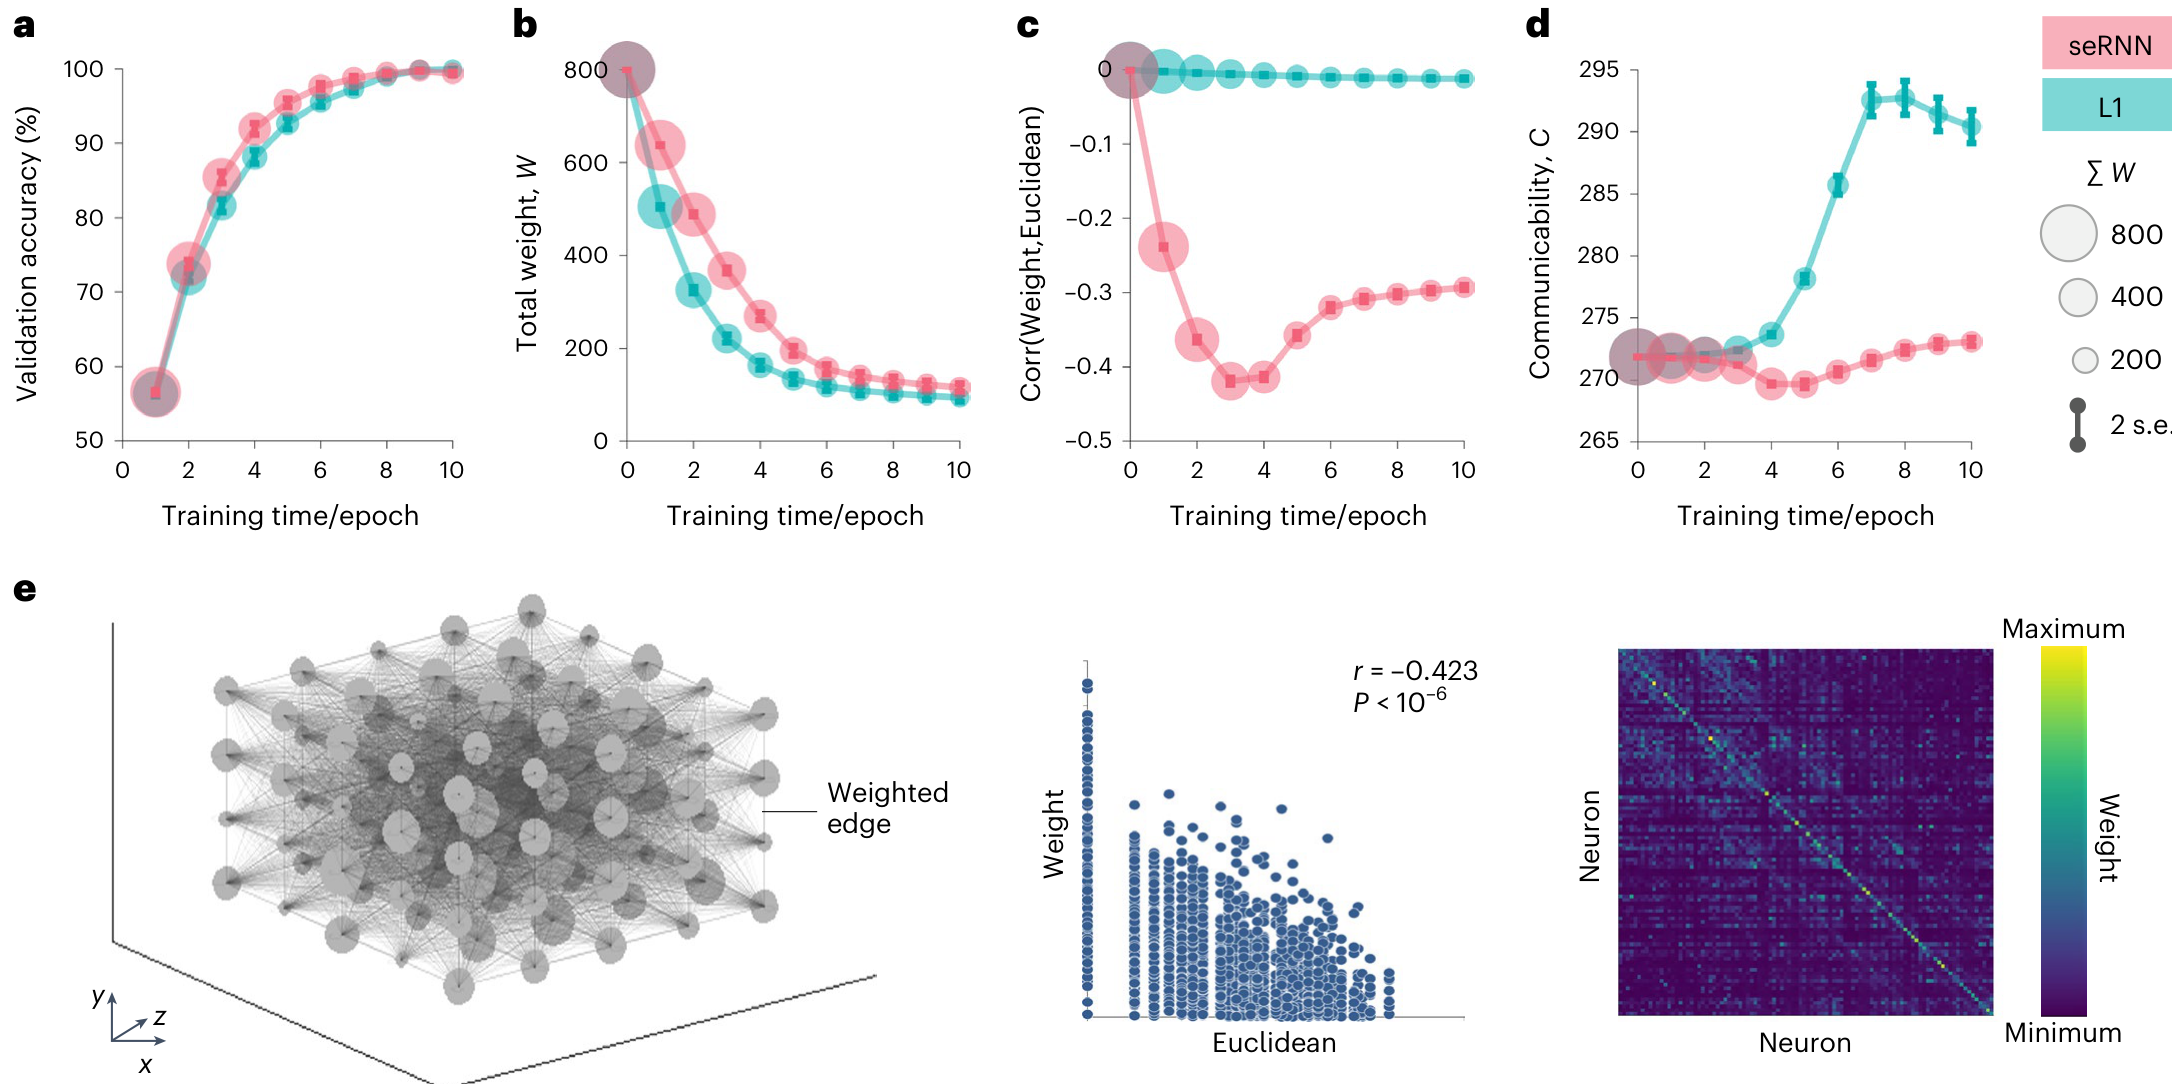
To understand how this spatial embedding impacts a network’s structure and function, we set up 2,000 RNNs. Half of the networks were seRNNs trained with the new optimization process described above. The other half were regular RNNs regularized with a standard L1 regularizer minimizing the sum of the absolute weights, to arrive at a population of baseline networks that match seRNNs in overall connectivity strength. In both cases, the regularizer was applied to the hidden recurrent layer of the network and the regularization strength was systematically varied within each subgroup of networks to cover a wide spectrum of regularization strength that is matched across subgroups
When training the networks, we found that both types of network manage to learn the task with high accuracy
Having shown that the new regularization function in seRNNs has the expected effects on the weight matrix of networks, we next tested which features result from the spatial embedding. Specifically, we tested whether seRNNs show features commonly observed in primate cerebral cortices, including structural motifs such as modularity 11, 12, 13 and small-worldness 14, 15, before testing for functional clustering of units in space 14, 15. We then go beyond structural and functional organization and test whether spatial embedding forces networks to implement an energy-efficient mixed-selective code 16, 17. In short, we wanted to test whether established organization properties of complex brain networks arise when we impose local biophysical constraints.
Modular small-world networks emerge from constraints
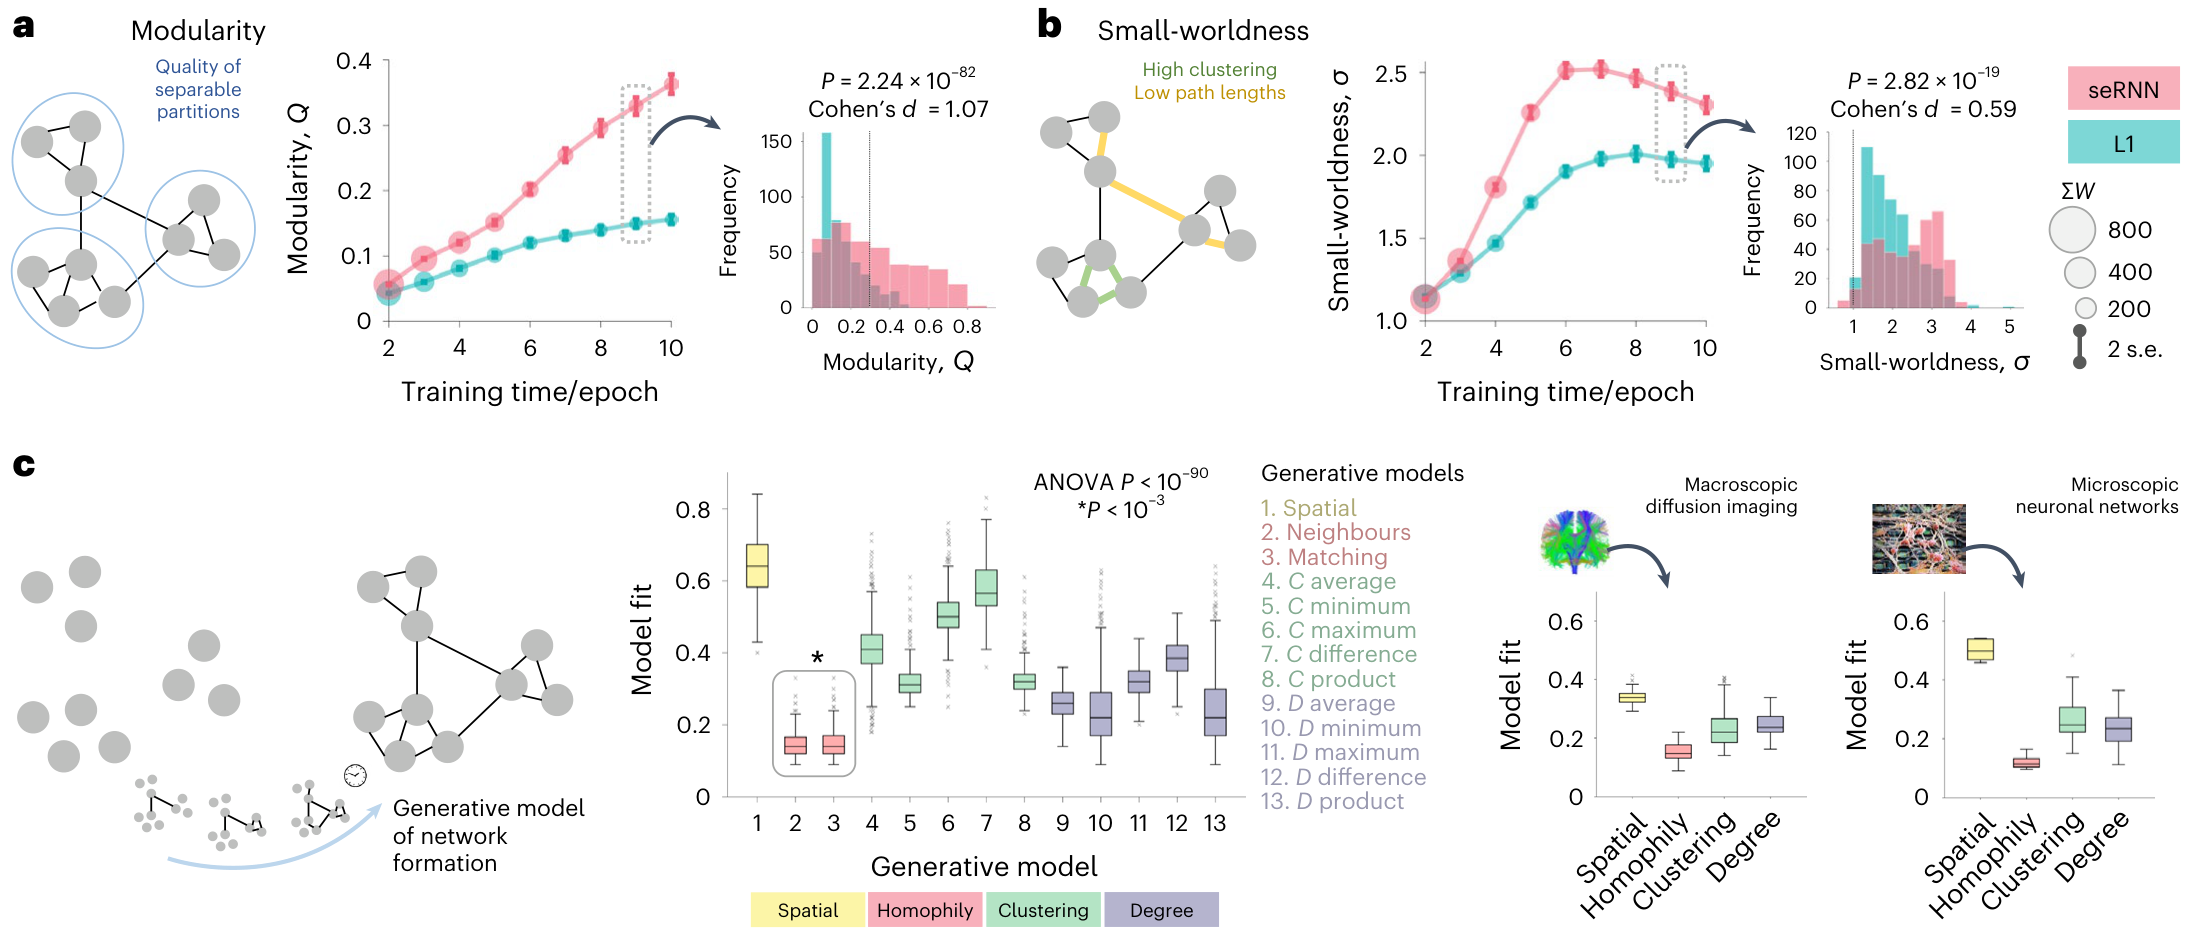
We first investigated two key topological characteristics that are commonly found in empirical brain networks across spatial scales
and proposed to facilitate brain function: modularity
Computing modularity
To further validate the structural likeness of seRNNs to empirical neural connectivity, we used generative network models
Functionally related units spatially organize in seRNNs
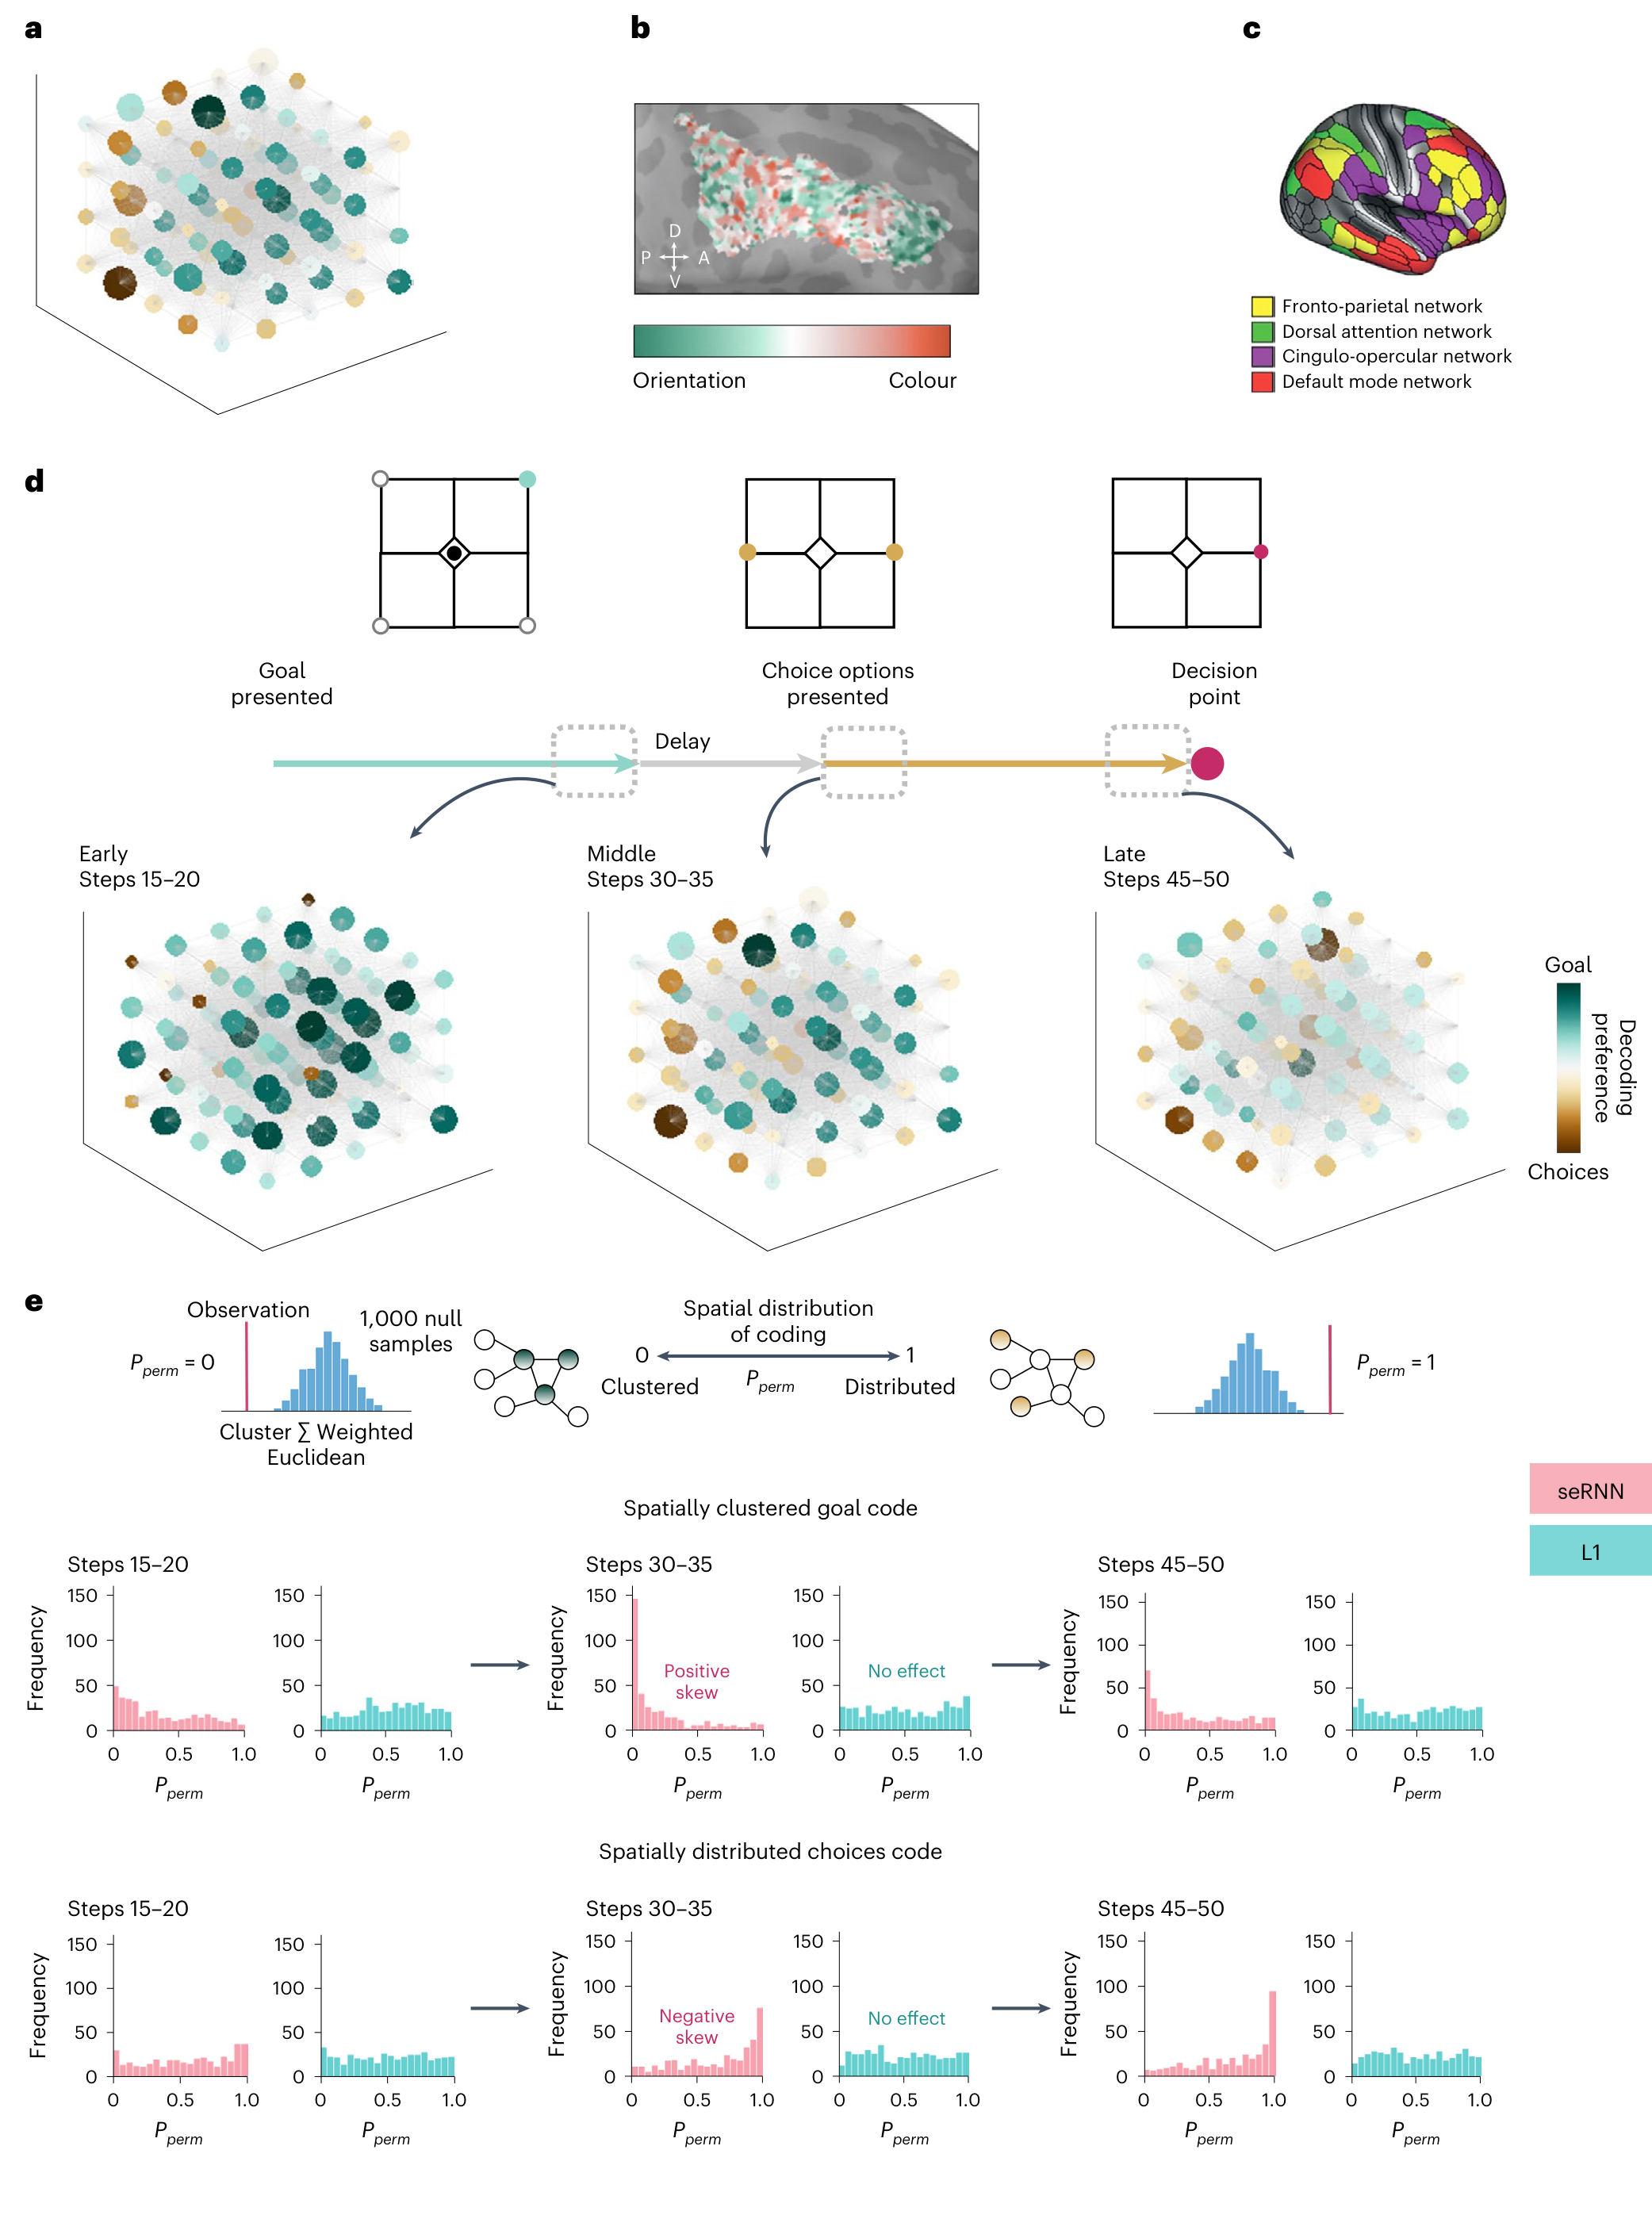
So far, we have explored how imposing biophysical constraints within seRNNs produces structures that mimic observed networks. However, this ignores the functional roles of neurons or their patterning within the network. We next examined this by exploring the configuration of functionally related neurons in 3D space (Fig. 4a). In brain networks, neurons sharing a tuning profile to a stimulus tend to spatially group
By taking the relative preference for goal versus choice for each unit, we tested whether the relative sensitivity to stimuli was concentrated in parts of the network. We used a spatial permutation test (‘Spatial permutation test’ in Methods) to test whether the Euclidean distance between highly ‘goal’ or ‘choice’ selective neurons was significantly less or more than would be expected by chance. A small
We tested for functional co-localization across three time windows of the trial (the total duration of a trial was 50 steps; Fig. 1e): (1) early stage (goal presented, steps 15–20); (2) middle stage (choice options presented, steps 30–35) and (3) late stage (decision point, steps 45–50). At the early stage, when only goal information is presented, neurons code for only the goal information (widespread dark green nodes in Fig. 4d, left). In seRNNs, there is a slight positive skew in
Mixed selectivity and energy-efficient coding
So far, we have shown that adding spatial constraints to a network gives rise to patterns of network connectivity that are highly reminiscent of observed biological networks. Nodes functionally co-localize and the spatial embedding causes differences in how they code task-relevant information. This selectivity profile has been widely studied. Studies show that neurons in task-positive brain regions tend to show a mixed selectivity profile, meaning that neurons do not only code for a single
Fig. 4 | Functional clustering and distribution of coding in space. a, An example of a representative seRNN network. The colour of the nodes relates to the decoding preference of that neuron, where a preference for goal information is represented by green and choices information by brown. b, The spatial clustering of neuronal ensembles that are preferentially tuned for orientation versus colour in human prefrontal cortex. The Dorsal-Ventral (D-V) and Anterior-Posterior (A-P) axes are shown. c, The macroscopic spatial organization of functional networks. d, We show decoding of units for goal (green) versus choice (brown) information at different points in the trial, within the representative seRNN network. e, A schematic illustration of the spatial permutation test for determining whether the neurons are functionally clustered (top left) or distributed (top right) in space. For this permutation test, we compute the summed Euclidean distance between units with an observed preference for goal or choice information, respectively, weighted by the magnitude of their preference (termed cluster weighted Euclidean). This gives a statistic, for every network, corresponding to the weighted distance between units (that is, goal or choice units) in space. To determine whether this statistic was equivalent to chance, for each statistic we computed a null distribution of expected distances between goal and choice units, respectively, under the assumption that they are randomly located in space. This was calculated by taking 1,000 random samples of the same size as the number of empirical neurons with a preference for goal or choice information. The relates to where the statistic sits within this null distribution, where each network gets a for goal and choice information. The skew of the towards zero shows that the code of networks is more clustered than the null distribution whereas a skew towards one highlights a more distributed code. The values across RNNs are given for goal information (middle) and choice information (bottom) for seRNNs (pink) and L1 networks (blue). Goal information is shown to be clustered, as given by the positively skewed distributions. In contrast, choice information is shown to be distributed. No adjustments were required for multiple comparisons. Panel b reproduced with permission from ref. 39, under a Creative Commons licence CC BY 4.0. Panel c adapted with permission from ref. 40, Elsevier.
Article
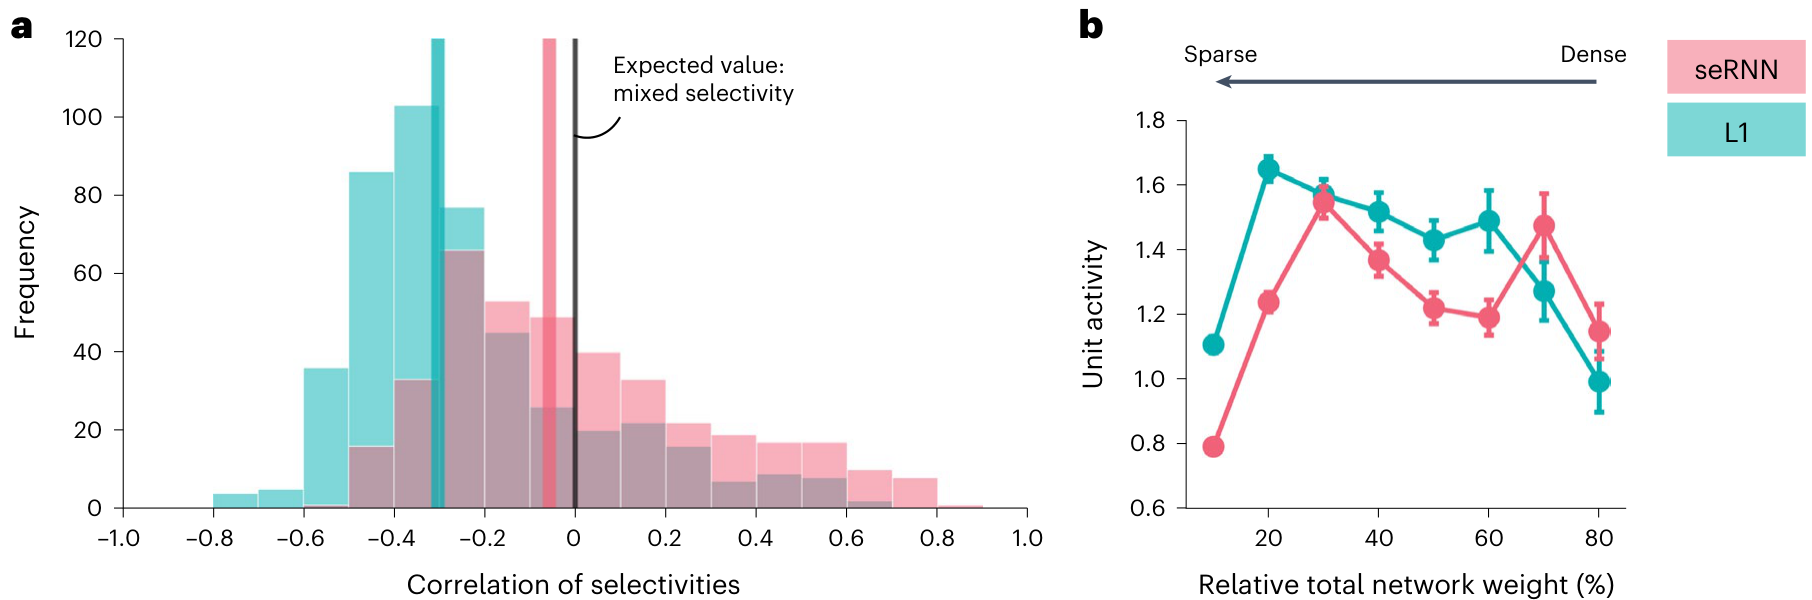
task variable but instead a mixture of them
We looked at the correlation of selectivities of trained networks (epoch 9) for the goal and choices variables. At the time in the trial when networks make a choice, the median correlation is
The choice of a neuronal code in populations of neurons is strongly linked to the question of energy demand. As the firing of action potentials uses a substantial amount of energy
Constraints cause linked brain-like structure and function
So far, we have seen that seRNNs show a collection of features that are commonly observed in brains but have not previously been related. The caveat not addressed so far is that for any feature we observed in seRNNs, we also see strong variation across the population of networks (for example, Fig. 3b for modularity or Fig. 5a for mixed selectivity). This opens the possibility that these features do not arise in parallel in seRNNs but instead each feature could emerge in its unique subgroup of networks. This would be unlike biological brains, which exist in a critical sweet-spot area
To study the co-occurrence of brain features in seRNNs, we looked at the distribution of feature magnitude across the space of training parameters (regularization strength, number of training epochs passed). Figure 6a shows matrix plots for accuracy (left), total sum of weights (middle left), modularity (middle right) and small-worldness (right) across the entire spectrum of training epochs ( axis) and regularization strengths ( axis). As before, there is variation in the magnitude of features across the population of networks, but now we also see that this variation is structured. Brain-like topology emerges in a sweet-spot of low to medium strength regularization and during the later training epochs (pink box). The schematic in Fig. 6b highlights this space of sparse, highly accurate, modular small-world networks with an example network showing all properties (Fig. 6b, middle right). Above this space (that is, networks with less regularization, highlighted in orange) networks can solve the task and show small-worldness, but remain very dense and lack the modular organization found in empirical brain networks. Below this space (that is, networks with more regularization, highlighted in light blue) networks show extreme sparsity and modularity, but fail to functionally converge on the task and they lose their small-world topology.
Next, we wanted to look at the same ‘sweet spot’ in terms of the network’s functional properties. As the decoding required us to focus this analysis on networks with high task performance (‘Decoding’ in Methods), we use networks with an accuracy >90% at epoch 9. Figure 6c shows the functional results across regularization strengths, highlighting the sweet spot of regularization from Fig. 6a with the pink box. In the first two plots from the top, we show two structural metrics (sparsity and short connection preference). We observed the same distribution when looking at the homophily generative wiring rule (Supplementary Fig. 11b). Looking at mixed selectivity (Fig. 6c,
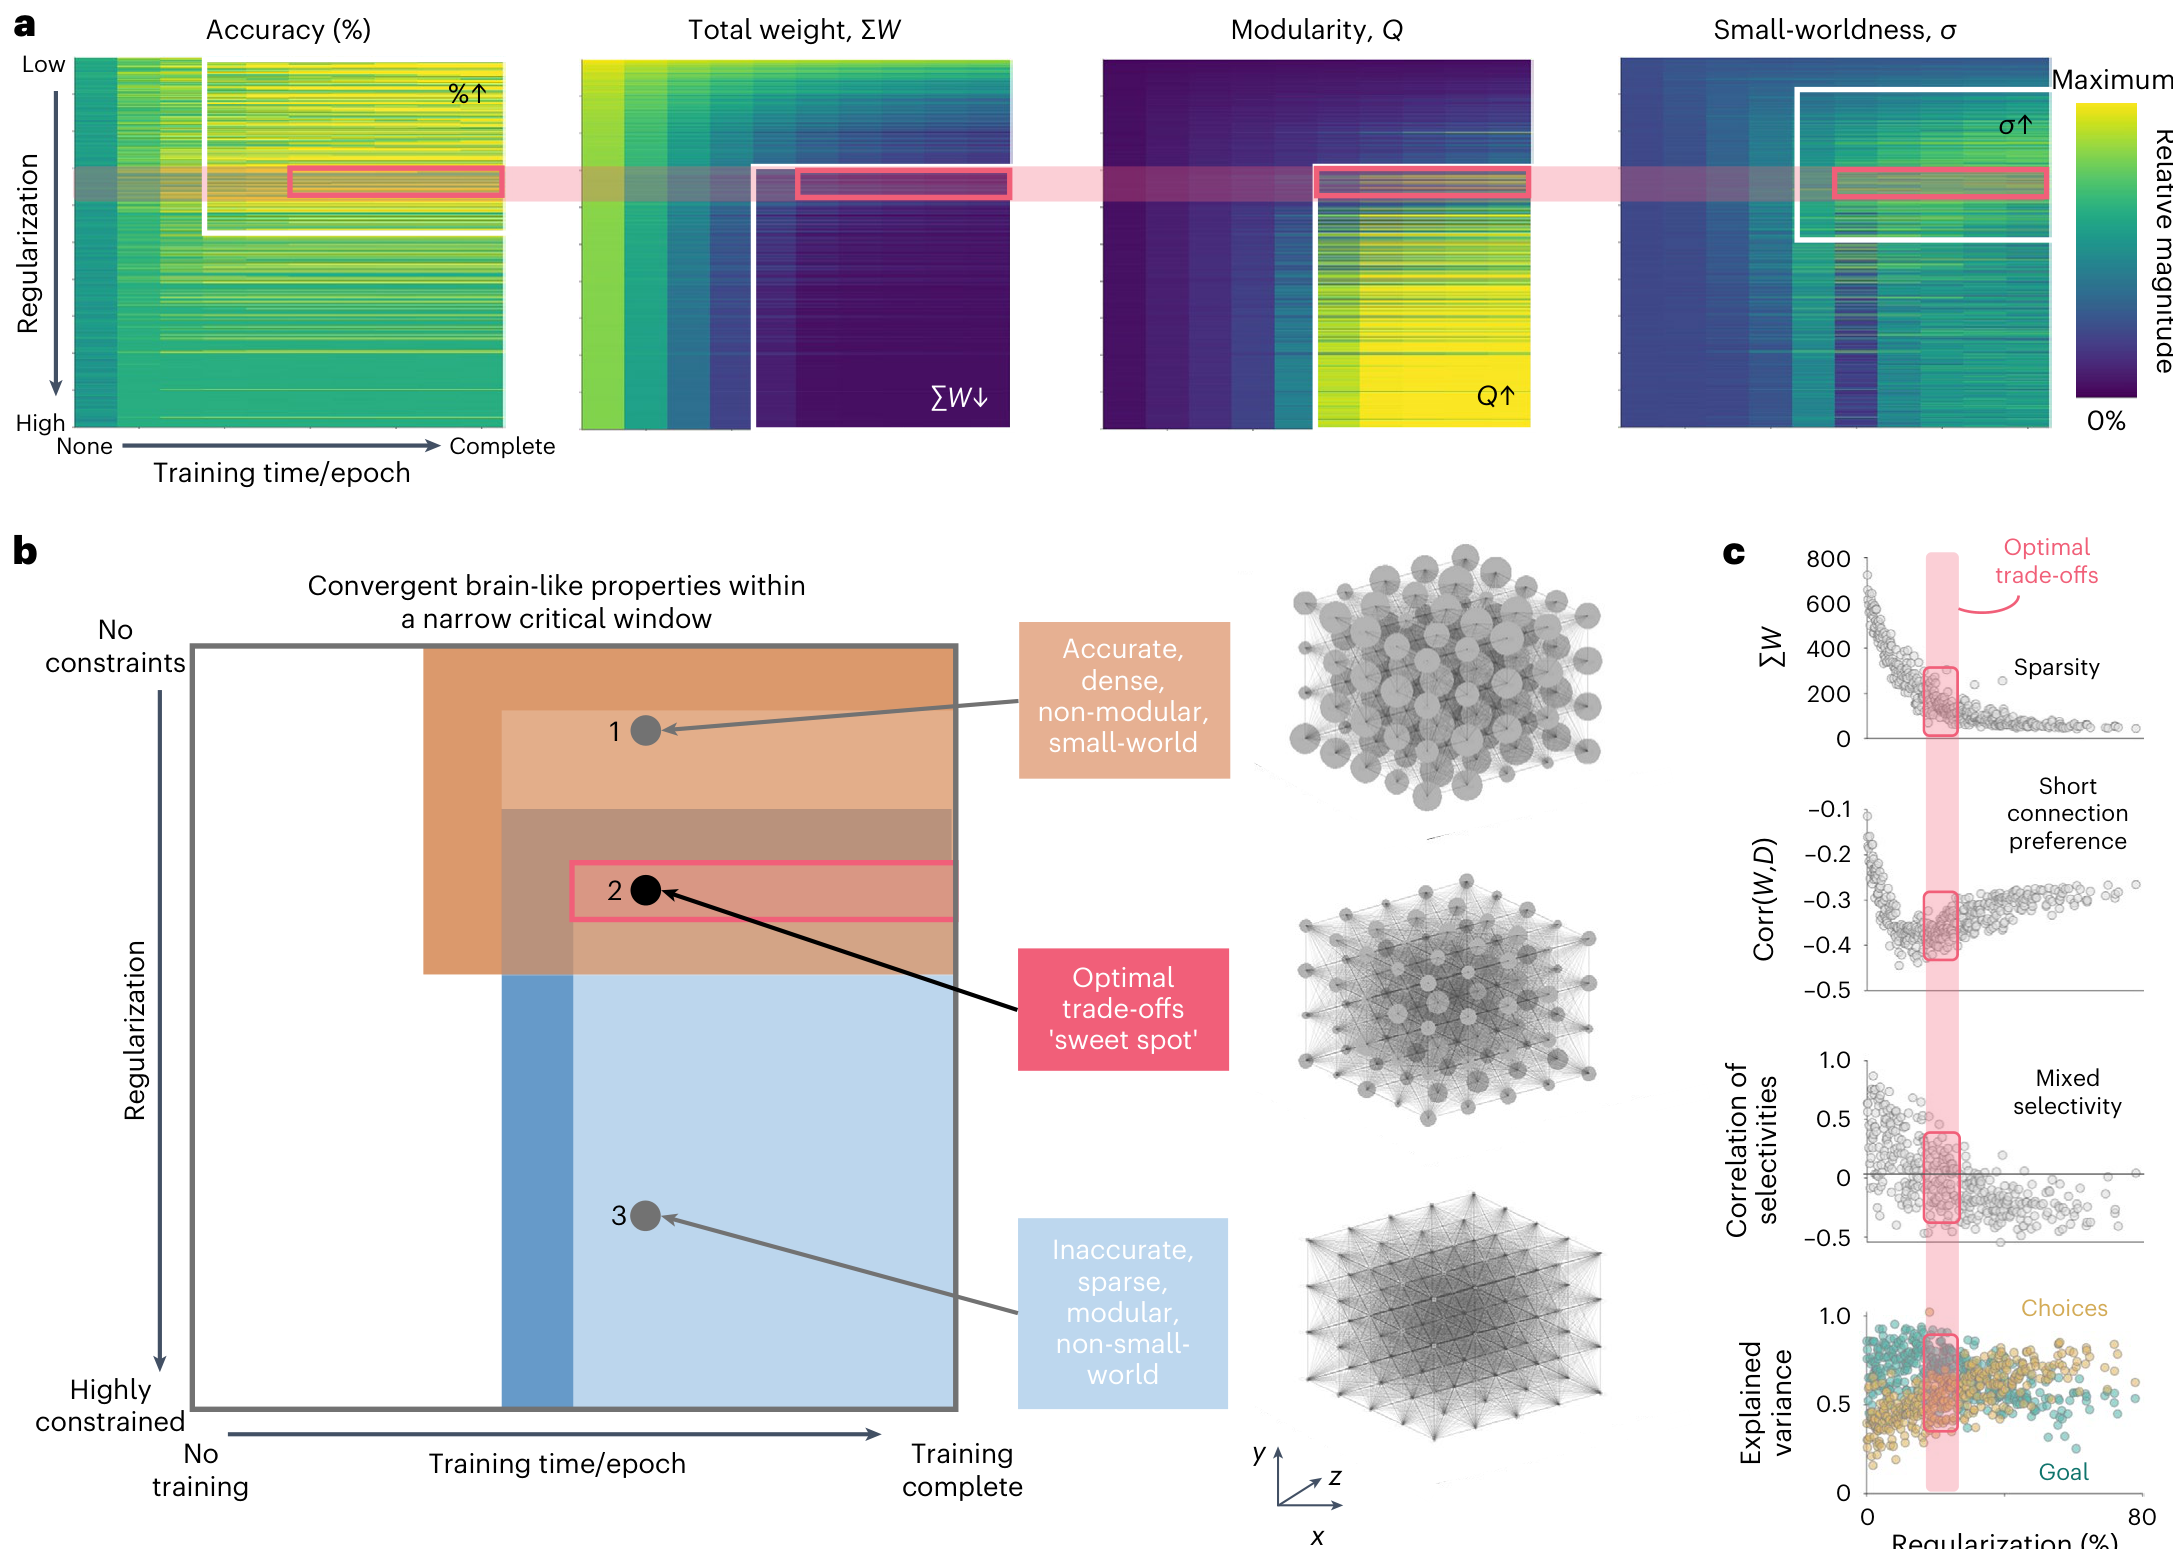
third from top), our analyses revealed that networks show a mixed-selective code at the decision point in the sweet-spot window identified before. Units here show a balanced code with information for both goal and choices (Fig. 6c, bottom), whereas very dense or sparse networks show a preference for either goal or choices information. As such, the density and related modular small-world structure influences the time horizon of information flowing through the network. Dense networks show greater focus on past information, which resonates with how functional networks reconfigure to support memory18. Supplementary Fig. 14 shows a correlation matrix showing pairwise relationships between features studied here.
Our findings show that there is a critical parameter window in which both structural and functional brain features jointly emerge in seRNNs. Brains are often said to live in a unique but critical niche where all characteristics needed to support their function can exist in parallel19. seRNNs show the same preference for a critical parameter window but also give us the ability to study networks on their way to converging on brain-like characteristics in this critical window.
Discussion
Functioning brains have key organizational features endowing them with computational capacities to perform a broad range of cognitive operations efficiently and flexibly. These include sparse connectivity with a modular small-world structure
Our model provides an important tool to continue the work on jointly studying structure and function in neuroscience models
There are many areas that we wish to improve on with future research. Principally, our models did not include a substantial amount of biological detail that, while inevitably critical for neuronal functioning, does not speak to the observations we aimed to recapitulate in the present study. Implementing such details including molecular mechanisms guiding circuit development
The development of seRNNs allowed us to observe the impact of optimizing task control, structural cost and network communication in a model system that can dynamically trade off its structural and functional objectives. This suggests that providing artificial neural networks with a topophysical structure
Methods
seRNN regularization function
In a canonical supervised RNN, all the network’s trainable parameters are optimized to minimize the difference between the predicted value and correct value. To achieve this, we define a task loss function
An RNN with this loss function would learn to solve the task with a sparse weight matrix
Unlike regular RNNs, real brain networks are embedded in a physical space
The above formalization provides a spatial context for RNN training. In a next step, we want to follow the same approach to incentivize networks to preferably prune weights that are not strongly contributing to the within-network communication structure. We can impose this influence of communication via a weighted communicability term
Supplementary Figs. 1–5 provide a walkthrough explanation of how this term works and expand on the logic of how constraining the network’s topology can serve as a prior for intra-network communication in sparse networks. Supplementary Fig. 6 specifically highlights the role that communicability has within the network optimization process. Note that in equation (6),
Importantly, as all terms (
Task paradigm
The task that networks are presented with is a one-choice inference task requiring networks to remember and integrate information (Fig. 1f). On an abstract level, networks needed to first store a stimulus, integrate it with a second stimulus and make a predefined correct choice. More specifically, networks first observe stimulus A for 20 time steps, followed by a delay for 10 time steps, followed by stimulus B for 20 steps. Agents must then make one choice. This set-up can be interpreted as a one-step navigation task, where agents are presented with the goal location (stimulus A) followed by possible choice directions (stimulus B). The choice to be made is the one moving closer to the goal. Extended
Data Table 1 outlines all possible trials and defines whether the given trial is included in the regular version of the task used in the main text.
All stimuli are one-hot encoded with a vector of eight binary digits. The first four define the goal locations and only one of the four digits would be set to one during the goal presentation. The second four binary digits each stand in for one allowed choice direction and two choice directions would be set to one during the choice options presentation. Gaussian noise with a standard deviation of 0.05 is added to all inputs.
This task design is a simplified version of a multi-step maze navigation task we have recorded in macaques. A harder version of the task with an extended set of trials is equivalent to the first choice monkeys face in their version of the task. We use the full set of trials for a control calculation in
RNN modelling
All recurrent neural networks in this project have 100 units in the hidden layer and are defined by the same basic set of equations:
Here
Networks differ in terms of which regularization was applied to its hidden layer and with which regularization strength. Networks are optimized to minimize a cross entropy loss on task performance combined with the regularization penalty using the Adam optimizer (hyperparameters: learning rate 0.001, beta_1 0.9, beta_2 0.999, epsilon
Regularization strength set-up and network selection
The most critical parameter choice in our analyses is the regularization strength. As shown across analyses
To make both groups comparable, we focus our analyses on networks that achieve >90% task accuracy. For the L1 networks, these were 47.9% of all trained networks and for seRNN networks 39%. Note that this difference in percentages is not meaningful per se and could be eliminated by matching the regularization spectra of both groups more closely. As we focus our analyses on highly functional networks with high task accuracy, matching the regularization spectra of both groups would have not influenced the results. The code repository has an overview file with regularization strengths chosen for different network types. We hope that future implementations of the seRNNs can provide a method for more precise numerical matching between regularization strengths.
Topological analysis
Graph theory network statistics were calculated using the Brain Connectivity Toolbox
Modularity. The modularity statistic,
where
Small-worldness. Small-worldness refers to a graph property where most nodes are not neighbours of one another, but the neighbours of nodes are likely to be neighbours of each other. This means that most nodes can be reached from every other node in a small number of steps. It is given by:
where
Generative network modelling
We use a technique called generative network modelling to investigate whether the connectome of networks can be recreated by unsupervised wiring rules. The idea is to start from an empty network and probabilistically add connections-based simple wiring equations. The wiring equations are based on the topological structure of the existing network. We follow the approach outlined in
Decoding
To analyse the internal function of our trained recurrent neural networks, we record the hidden state activity of every unit while the
network solves a set of 640 trials. Each trial is constituted of 50 steps
- Apply cross-validated L1 regression with
k -fold cross validation (5 folds) to set alpha term with best cross-validation performance. - Split the dataset via repeated
k -fold (3 folds, 2 repeats). - On each (train, test) dataset:
a. Train L1 regression with the pre-set alpha term.
b. Calculate explained variance in test dataset including all predictor variables.
c. Iteratively set all values of a given set of predictors (for example, all goal predictors) to 0 and recalculate the explained variance and calculate the drop of explained variance per predictor group.
d. Take mean of drop of explained variance for each group across splits of dataset.
This algorithm results in every unit in every network being assigned an explained variance number for every task variable. Note that the decoding cannot reliably work in networks that make too many errors, so that we functionally analyse only networks with a task performance of 90% or above.
Spatial permutation test
To examine the spatial clustering of decoded task information of neuronal ensembles within the RNNs, we constructed a simple spatial permutation test as follows.
- Considering a single RNN hidden layer at a particular task time window (note, explained variances change over the course of the task), for each unit, compute the relative preference for goal versus choice explained variance for each unit. This is calculated as the goal explained variance minus the choice explained variance.
- Between all
n ‘goal’ units (that is, positive difference from step 1), compute the Euclidean distance weighted by the decoding for goal information. This, therefore, captures the spatial proximity between goal units weighted by the magnitude of their ‘goal’ information. Average this matrix to compute a summary statistic. This is the observed statistic. - Then repeat this procedure for 1,000 times, but for a random set of
n units taken from the 3D grid space. These 1,000 summary statistics constitutes the null distribution. - Compute a permuted value ()
P perm , which is simply the location in which the observed statistic (step 2) sits within the null distribution (step 3) normalized to the rangezero to one . This value subsequently corresponds to how clustered or distributed the observed goal decoding information is clustered in space relative to random chance. A smallP perm means that information is clustered more than chance and vice versa. - Do steps 1–4, but between all ‘choices’ units (that is, negative difference from step 1).
- Redo steps 1–5 for all desired time windows that have been decoded. In the current work, we calculated
P perm values for time window 3, time window 6 and time window 9 to reflect different aspects of the task over the sequence of the task.
The above steps were done for all functional RNNs (
Reporting summary
Further information on research design is available in the Nature Portfolio Reporting Summary linked to this article.
Data availability
No unique data were used in the production of this paper. Reference values were extracted from the respective cited reference. All data shown in the figures are based on simulations, which are described in the ‘Code availability’ section. The data files generated with simulations that underlie the figures are available in the CodeOcean capsule belonging to this paper20.
Code availability
We provide detailed walkthroughs for the training of our recurrent neural networks alongside all the code used to create the plots in this paper on CodeOcean20. We provide additional example implementations of seRNNs on GitHub. As new implementations of seRNNs become available, we will add them to this paper’s GitHub repository alongside the implementation used for this project. The GitHub repository is https://github.com/8erberg/spatially-embedded-RNN.
References
- Fair, D. A. et al. Functional brain networks develop from a ‘local to distributed’ organization. PLoS Comput. Biol. 5, e1000381 (2009).
- Kaiser, M. Mechanisms of connectome development. Trends Cogn. Sci. 21, 703–717 (2017).
- Bosman, C. & Aboitiz, F. Functional constraints in the evolution of brain circuits. Front. Neurosci. 9, 303 (2015).
- Heuvel van den, M. P., Bullmore, E. T. & Sporns, O. Comparative connectomics. Trends Cogn. Sci. 20, 345–361 (2016).
- Hiratani, N. & Latham, P. E. Developmental and evolutionary constraints on olfactory circuit selection. Proc. Natl Acad. Sci. USA 119, e2100600119 (2022).
- Mišić, B. et al. Network-level structure–function relationships in human neocortex. Cereb. Cortex 26, 3285–3296 (2016).
- Smith, V. et al. Fluid intelligence and naturalistic task impairments after focal brain lesions. Cortex 146, 106–115 (2022).
- Doerig, A. et al. The neuroconnectionist research programme. Nat. Rev. Neurosci. https://doi.org/10.1038/s41583-023-00705-w (2023).
- Kaiser, M. & Hilgetag, C. C. Modelling the development of cortical systems networks. Neurocomputing 58–60, 297–302 (2004).
Article https://doi.org/10.1038/s42256-023-00748-9
- Mante, V., Sussillo, D., Shenoy, K. V. & Newsome, W. T. Context-dependent computation by recurrent dynamics in prefrontal cortex. Nature 503, 78–84 (2013).
- Ali, A., Ahmad, N., De Groot, E., Johannes Van Gerven, M. A. & Kietzmann, T. C. Predictive coding is a consequence of energy efficiency in recurrent neural networks. Patterns 3, 100639 (2022).
- Barthélemy, M. Spatial networks. Phys. Rep. 499, 1–101 (2011).
- Bassett, D. S. & Stiso, J. Spatial brain networks. C. R. Phys. 19, 253–264 (2018).
- Bullmore, E. & Sporns, O. The economy of brain network organization. Nat. Rev. Neurosci. 13, 336–349 (2012).
- Akarca, D. et al. Homophilic wiring principles underpin neuronal network topology in vitro. Preprint at bioRxiv https://doi.org/10.1101/2022.03.09.483605 (2022).
- Song, H. F., Kennedy, H. & Wang, X.-J. Spatial embedding of structural similarity in the cerebral cortex. Proc. Natl Acad. Sci. USA 111, 16580–16585 (2014).
- Avena-Koenigsberger, A., Misic, B. & Sporns, O. Communication dynamics in complex brain networks. Nat. Rev. Neurosci. 19, 17–33 (2018).
- Laughlin, S. B. & Sejnowski, T. J. Communication in neuronal networks. Science 301, 1870–1874 (2003).
- Crofts, J. J. & Higham, D. J. A weighted communicability measure applied to complex brain networks. J. R. Soc. Interface 6, 411–414 (2009).
- Griffa, A. et al. The evolution of information transmission in mammalian brain networks. Preprint at bioRxiv https://doi.org/10.1101/2022.05.09.491115 (2022).
- Seguin, C., Mansour L, S., Sporns, O., Zalesky, A. & Calamante, F. Network communication models narrow the gap between the modular organization of structural and functional brain networks. NeuroImage 257, 119323 (2022).
- Estrada, E. & Hatano, N. Communicability in complex networks. Phys. Rev. E 77, 036111 (2008).
- Betzel, R. F., Medaglia, J. D. & Bassett, D. S. Diversity of meso-scale architecture in human and non-human connectomes. Nat. Commun. 9, 346 (2018).
- Bertolero, M. A., Yeo, B. T. T. & D’Esposito, M. The modular and integrative functional architecture of the human brain. Proc. Natl Acad. Sci. USA 112, E6798–E6807 (2015).
- Park, H.-J. & Friston, K. Structural and functional brain networks: from connections to cognition. Science 342, 1238411 (2013).
- Sporns, O. & Betzel, R. F. Modular brain networks. Annu. Rev. Psychol. 67, 613–640 (2016).
- Bassett, D. S. & Bullmore, E. T. Small-world brain networks revisited. Neuroscientist 23, 499–516 (2017).
- Sporns, O. & Zwi, J. D. The small world of the cerebral cortex. Neuroinformatics 2, 145–162 (2004).
- Johnston, W. J., Palmer, S. E. & Freedman, D. J. Nonlinear mixed selectivity supports reliable neural computation. PLoS Comput. Biol. 16, e1007544 (2020).
- Rigotti, M. et al. The importance of mixed selectivity in complex cognitive tasks. Nature 497, 585–590 (2013).
- Hilger, K., Ekman, M., Fiebach, C. J. & Basten, U. Intelligence is associated with the modular structure of intrinsic brain networks. Sci. Rep. 7, 16088 (2017).
- Watts, D. J. & Strogatz, S. H. Collective dynamics of ‘small-world’ networks. Nature 393, 440–442 (1998).
- Bassett, D. S. & Sporns, O. Network neuroscience. Nat. Neurosci. 20, 353–364 (2017).
- Betzel, R. F. et al. Generative models of the human connectome. NeuroImage 124, 1054–1064 (2016).
- Akarca, D., Vértes, P. E., Bullmore, E. T. & Astle, D. E. A generative network model of neurodevelopmental diversity in structural brain organization. Nat. Commun. 12, 4216 (2021).
- Vértes, P. E. et al. Simple models of human brain functional networks. Proc. Natl Acad. Sci. USA 109, 5868–5873 (2012).
- Kanwisher, N. Functional specificity in the human brain: a window into the functional architecture of the mind. Proc. Natl Acad. Sci. USA 107, 11163–11170 (2010).
- Thompson, W. H. & Fransson, P. Spatial confluence of psychological and anatomical network constructs in the human brain revealed by a mass meta-analysis of fMRI activation. Sci. Rep. 7, 44259 (2017).
- Waskom, M. L. & Wagner, A. D. Distributed representation of context by intrinsic subnetworks in prefrontal cortex. Proc. Natl Acad. Sci. USA 114, 2030–2035 (2017).
- Ji, J. L. et al. Mapping the human brain’s cortical-subcortical functional network organization. NeuroImage 185, 35–57 (2019).
- Steinmetz, N. A., Zatka-Haas, P., Carandini, M. & Harris, K. D. Distributed coding of choice, action and engagement across the mouse brain. Nature 576, 266–273 (2019).
- Wallach, A., Melanson, A., Longtin, A. & Maler, L. Mixed selectivity coding of sensory and motor social signals in the thalamus of a weakly electric fish. Curr. Biol. 32, 51–63.e3 (2022).
- Hirokawa, J., Vaughan, A., Masset, P., Ott, T. & Kepecs, A. Frontal cortex neuron types categorically encode single decision variables. Nature 576, 446–451 (2019).
- Whittington, J. C. R., Dorrell, W., Ganguli, S. & Behrens, T. E. J. Disentanglement with biological constraints: a theory of functional cell types. In The Eleventh International Conference on Learning Representations ICLR, 2023.
- Fusi, S., Miller, E. K. & Rigotti, M. Why neurons mix: high dimensionality for higher cognition. Curr. Opin. Neurobiol. 37, 66–74 (2016).
- Bernardi, S. et al. The geometry of abstraction in the hippocampus and prefrontal cortex. Cell 183, 954–967.e21 (2020).
- Erez, Y. et al. Integrated neural dynamics for behavioural decisions and attentional competition in the prefrontal cortex. Eur. J. Neurosci. 56, 4393–4410 (2022).
- Attwell, D. & Laughlin, S. B. An energy budget for signaling in the grey matter of the brain. J. Cereb. Blood Flow Metab. 21, 1133–1145 (2001).
- Beggs, J. M. The criticality hypothesis: how local cortical networks might optimize information processing. Phil. Trans. R. Soc. Math. Phys. Eng. Sci. 366, 329–343 (2008).
- Cohen, J. R. & D’Esposito, M. The segregation and integration of distinct brain networks and their relationship to cognition. J. Neurosci. 36, 12083–12094 (2016).
- O’Byrne, J. & Jerbi, K. How critical is brain criticality? Trends Neurosci. 45, 820–837 (2022).
- Yan, C. & He, Y. Driving and driven architectures of directed small-world human brain functional networks. PLoS ONE 6, e23460 (2011).
- Suárez, L. E., Richards, B. A., Lajoie, G. & Misic, B. Learning function from structure in neuromorphic networks. Nat. Mach. Intell. 3, 771–786 (2021).
- Lindsay, G. W., Rigotti, M., Warden, M. R., Miller, E. K. & Fusi, S. Hebbian learning in a random network captures selectivity properties of the prefrontal cortex. J. Neurosci. 37, 11021–11036 (2017).
- Finzi, D., Margalit, E., Kay, K., Yamins, D. L. & Grill-Spector, K. Topographic DCNNs trained on a single self-supervised task capture the functional organization of cortex into visual processing streams. In NeurIPS 2022 Workshop SVRHM (2022); https://openreview.net/forum?id=E1iY-d13smd
- Damicelli, F., Hilgetag, C. C. & Goulas, A. Brain connectivity meets reservoir computing. PLOS Comput. Biol. 18, e1010639 (2022).
- Goulas, A., Damicelli, F. & Hilgetag, C. C. Bio-instantiated recurrent neural networks: integrating neurobiology-based network topology in artificial networks. Neural Netw. 142, 608–618 (2021).
- Zador, A. et al. Catalyzing next-generation artificial intelligence through NeuroAI. Nat. Commun. 14, 1597 (2023).
- Moons, L. & De Groef, L. Molecular mechanisms of neural circuit development and regeneration. Int. J. Mol. Sci. 22, 4593 (2021).
- Perez-Nieves, N., Leung, V. C. H., Dragotti, P. L. & Goodman, D. F. M. Neural heterogeneity promotes robust learning. Nat. Commun. 12, 5791 (2021).
- Baxter, R. A. & Levy, W. B. Constructing multilayered neural networks with sparse, data-driven connectivity using biologically-inspired, complementary, homeostatic mechanisms. Neural Netw. 122, 68–93 (2020).
- Chechik, G., Meilijson, I. & Ruppin, E. Synaptic pruning in development: a computational account. Neural Comput. 10, 1759–1777 (1998).
- Johnson, M. H. Interactive specialization: a domain-general framework for human functional brain development? Dev. Cogn. Neurosci. 1, 7–21 (2011).
- Siugzdaite, R., Bathelt, J., Holmes, J. & Astle, D. E. Transdiagnostic brain mapping in developmental disorders. Curr. Biol. 30, 1245–1257.e4 (2020).
- Bassett, D. S. et al. Efficient physical embedding of topologically complex information processing networks in brains and computer circuits. PLoS Comput. Biol. 6, e1000748 (2010).
- Sperry, M. M., Telesford, Q. K., Klimm, F. & Bassett, D. S. Rentian scaling for the measurement of optimal embedding of complex networks into physical space. J. Complex Netw. 5, 199–218 (2017).
- Hardt, M. & Recht, B. Patterns, Predictions, and Actions (Princeton Univ. Press, 2022).
- Kietzmann, T. C. et al. Recurrence is required to capture the representational dynamics of the human visual system. Proc. Natl Acad. Sci. USA 116, 21854–21863 (2019).
- Yang, G. R., Joglekar, M. R., Song, H. F., Newsome, W. T. & Wang, X.-J. Task representations in neural networks trained to perform many cognitive tasks. Nat. Neurosci. 22, 297–306 (2019).
- Tibshirani, R. Regression shrinkage and selection via the LASSO. J. R. Stat. Soc. Ser. B 58, 267–288 (1996).
- Rubinov, M. & Sporns, O. Complex network measures of brain connectivity: uses and interpretations. NeuroImage 52, 1059–1069 (2010).
- Achterberg, J., Akarca, D., Strouse, D. J., Duncan, J. & Astle, D. E. Capsule for Achterberg & Akarca, et al: Spatially-embedded recurrent neural networks reveal widespread links between structural and functional neuroscience findings. CodeOcean https://doi.org/10.24433/CO.3539394.v2 (2023).
Acknowledgements
We thank M. Botvinick for helpful comments and input throughout the development of this project. We thank M. Dillinger for detailed comments on the paper.
Author contributions
Competing interests
The authors declare no competing interests.
Additional information
Extended data is available for this paper at https://doi.org/10.1038/s42256-023-00748-9.
Supplementary information The online version contains supplementary material available at https://doi.org/10.1038/s42256-023-00748-9.
Correspondence and requests for materials should be addressed to Jascha Achterberg or Danyal Akarca.
Peer review information Nature Machine Intelligence thanks Bratislav Misic, and the other, anonymous, reviewer(s) for their contribution to the peer review of this work.
Reprints and permissions information is available at www.nature.com/reprints.
Publisher’s note Springer Nature remains neutral with regard to jurisdictional claims in published maps and institutional affiliations.
© The Author(s) 2023
Extended Data Table 1 | List of all problems that make up the task that networks are trained on
| Problem | Stimulus A | Stimulus B | Correct Choice | Regular Task |
|---|---|---|---|---|
| 1 | (Right, up) | Left, right | Right | No |
| 2 | (Right, up) | Right, down | Right | Yes |
| 3 | (Right, up) | Up, down | Up | No |
| 4 | (Right, up) | Up, left | Up | Yes |
| 5 | (Right, down) | Left, right | Right | Yes |
| 6 | (Right, down) | Up, right | Right | No |
| 7 | (Right, down) | Up, down | Down | No |
| 8 | (Right, down) | Left, down | Down | Yes |
| 9 | (Left, up) | Left, right | Left | Yes |
| 10 | (Left, up) | Left, down | Left | No |
| 11 | (Left, up) | Up, down | Up | No |
| 12 | (Left, up) | Up, right | Up | Yes |
| 13 | (Left, down) | Left, right | Left | No |
| 14 | (Left, down) | Up, left | Left | Yes |
| 15 | (Left, down) | Up, down | Down | No |
| 16 | (Left, down) | Right, down | Down | Yes |
Corresponding author(s): Jascha Achterberg, Danyal Akarca
Last updated by author(s): Sep 14, 2023
Reporting Summary
Nature Portfolio wishes to improve the reproducibility of the work that we publish. This form provides structure for consistency and transparency in reporting. For further information on Nature Portfolio policies, see our Editorial Policies and the Editorial Policy Checklist.
Statistics
For all statistical analyses, confirm that the following items are present in the figure legend, table legend, main text, or Methods section.
| n/a | Confirmed | |
|---|---|---|
| ☐ | ☒ | The exact sample size () for each experimental group/condition, given as a discrete number and unit of measurement |
| ☐ | ☒ | A statement on whether measurements were taken from distinct samples or whether the same sample was measured repeatedly |
| ☐ | ☒ | The statistical test(s) used AND whether they are one- or two-sided Only common tests should be described solely by name; describe more complex techniques in the Methods section. |
| ☐ | ☒ | A description of all covariates tested |
| ☐ | ☒ | A description of any assumptions or corrections, such as tests of normality and adjustment for multiple comparisons |
| ☐ | ☒ | A full description of the statistical parameters including central tendency (e.g. means) or other basic estimates (e.g. regression coefficient) AND variation (e.g. standard deviation) or associated estimates of uncertainty (e.g. confidence intervals) |
| ☐ | ☒ | For null hypothesis testing, the test statistic (e.g. , , ) with confidence intervals, effect sizes, degrees of freedom and value noted Give P values as exact values whenever suitable. |
| ☒ | ☐ | For Bayesian analysis, information on the choice of priors and Markov chain Monte Carlo settings |
| ☒ | ☐ | For hierarchical and complex designs, identification of the appropriate level for tests and full reporting of outcomes |
| ☐ | ☒ | Estimates of effect sizes (e.g. Cohen’s , Pearson’s ), indicating how they were calculated |
Software and code
Policy information about availability of computer code
Data collection
GRAY
The data used in our manuscript was generated using Python (3.7.9) and Tensorflow (2.3.0) as outlined in the manuscripts methods. The GitHub repository and Code Ocean Capsule linked in the manuscript provides a working version of the new Recurrent Neural Networks developed in this manuscript.
Data analysis
GRAY
Our data analysis was based on Python (3.9.1), Numpy (1.19.2), statsmodels (0.12.1) scikit-learn (0.23.2), scipy (1.5.2), pandas (1.2.1), Matlab 2020b; Brain Connectivity Toolbox 2019 brain-connectivity-toolbox.net
Data
Policy information about availability of data
All manuscripts must include a data availability statement. This statement should provide the following information, where applicable:
- Accession codes, unique identifiers, or web links for publicly available datasets
- A description of any restrictions on data availability
- For clinical datasets or third party data, please ensure that the statement adheres to our policy
GRAY
We provide detailed walkthroughs for the training of our recurrent neural networks alongside all the code used to create the plots in this manuscript on CodeOcean
Human research participants
Policy information about studies involving human research participants and Sex and Gender in Research.
| Reporting on sex and gender | NA |
| Population characteristics | NA |
| Recruitment | NA |
| Ethics oversight | NA |
Field-specific reporting
Please select the one below that is the best fit for your research. If you are not sure, read the appropriate sections before making your selection.
Life sciences
Behavioural & social sciences
Ecological, evolutionary & environmental sciences
For a reference copy of the document with all sections, see nature.com
Life sciences study design
All studies must disclose on these points even when the disclosure is negative.
| Sample size | We sample 1000 networks per group (seRNN vs L1 networks), so 2000 networks in total. We sample an additional set of 1000 networks for supplementary control analyses (seRNN [standard], seRNN [hard task], seRNN [random inputs], seRNN [Distance only], seRNN [Communicability only], seRNN [Short delay period], seRNN [Long delay period], seRNN [Low noise], seRNN [High noise], L1; 100 networks per group). |
| Data exclusions | In this manuscript we only analyse networks which reach > 90% task accuracy. Note that we do not apply an accuracy criteria for the seRNN [random inputs] control group used in supplementary control analyses. |
| Replication | As we based our analysis on large groups of independently trained networks we already show that our results replicate across networks. Our results are limited to a subset of the parameter space as discussed in the manuscript. The exact training parameters are available in the Code Ocean Capsule. |
| Randomization | NA |
| Blinding | NA |
Reporting for specific materials, systems and methods
We require information from authors about some types of materials, experimental systems and methods used in many studies. Here, indicate whether each material, system or method listed is relevant to your study. If you are not sure if a list item applies to your research, read the appropriate section before selecting a response.
| Materials & experimental systems | Methods | ||
|---|---|---|---|
| n/a | Involved in the study | n/a | Involved in the study |
| Antibodies | ChIP-seq | ||
| Eukaryotic cell lines | Flow cytometry | ||
| Palaeontology and archaeology | MRI-based neuroimaging | ||
| Animals and other organisms | |||
| Clinical data | |||
| Dual use research of concern |
