- Take any random variable with finite variance.
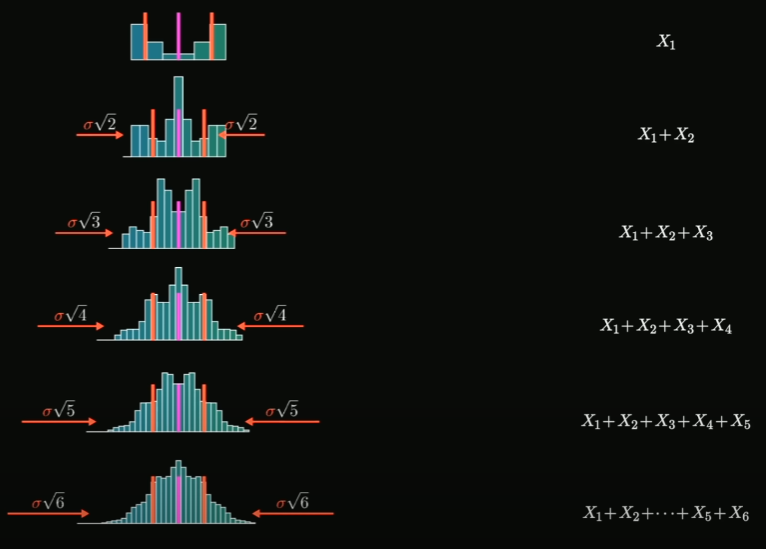
- Add samples of this variable
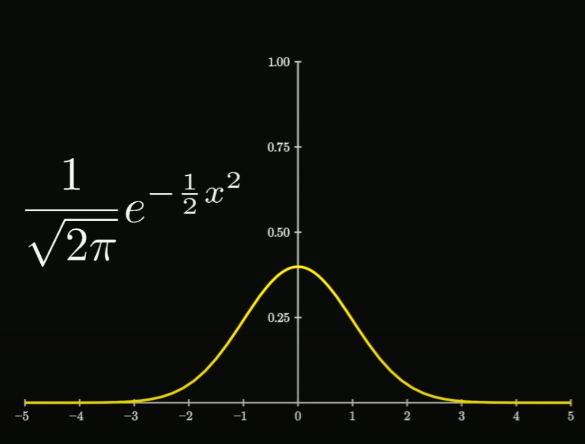
- The distribution of this sum looks more and more like a bell curve as
→ A collection of iid random variables with finite variance have a sample mean that is distributed normally:
can be different measurements of the same random variable, different random variables, non-normally distributed ones, etc.
Another way of writing it, describing the sum of the random variables
Visually:
If we roll the dice a couple of times… add those distributions together and normalize them (zero mean, unit std), the distribution of values takes on the shape of a bell curve: