∣A∣ … number of events where A occurs / number of ways A can happen. ∣Ω∣ … number of possible events.
→ 0≤P(A)≤1
The probability P is a map from subsets of the sample space Ω (the set of all possible outcomes of a random experiment) to the real numbers:
P:2Ω→R[0,1]∈R
P(Ω)=1 … the probability of something happening is 1. P(∅)=0 … the probability of nothing happening is 0. A⊆Ω⟹P(A)≥0 … probability of an event is always non-negative. A⊆B⟹P(A)≤P(B) … a subset of events has a smaller probability than the set it’s a subset of. P(Ac)=1−P(A) … the probability of A not happening. Also sometimes denoted as P(¬A) (surprise, but without the log).
Flip a fair coin twice. What’s the probability of at least one heads occuring?
Ω={hh,ht,th,tt} A={hh,ht,th} P(A)=43
Probability is just combinatorics, i.e. the math of combinations and proportions
Thinking of probability geometrically, as proportions (relative sizes of sets) is incredibly helpful:
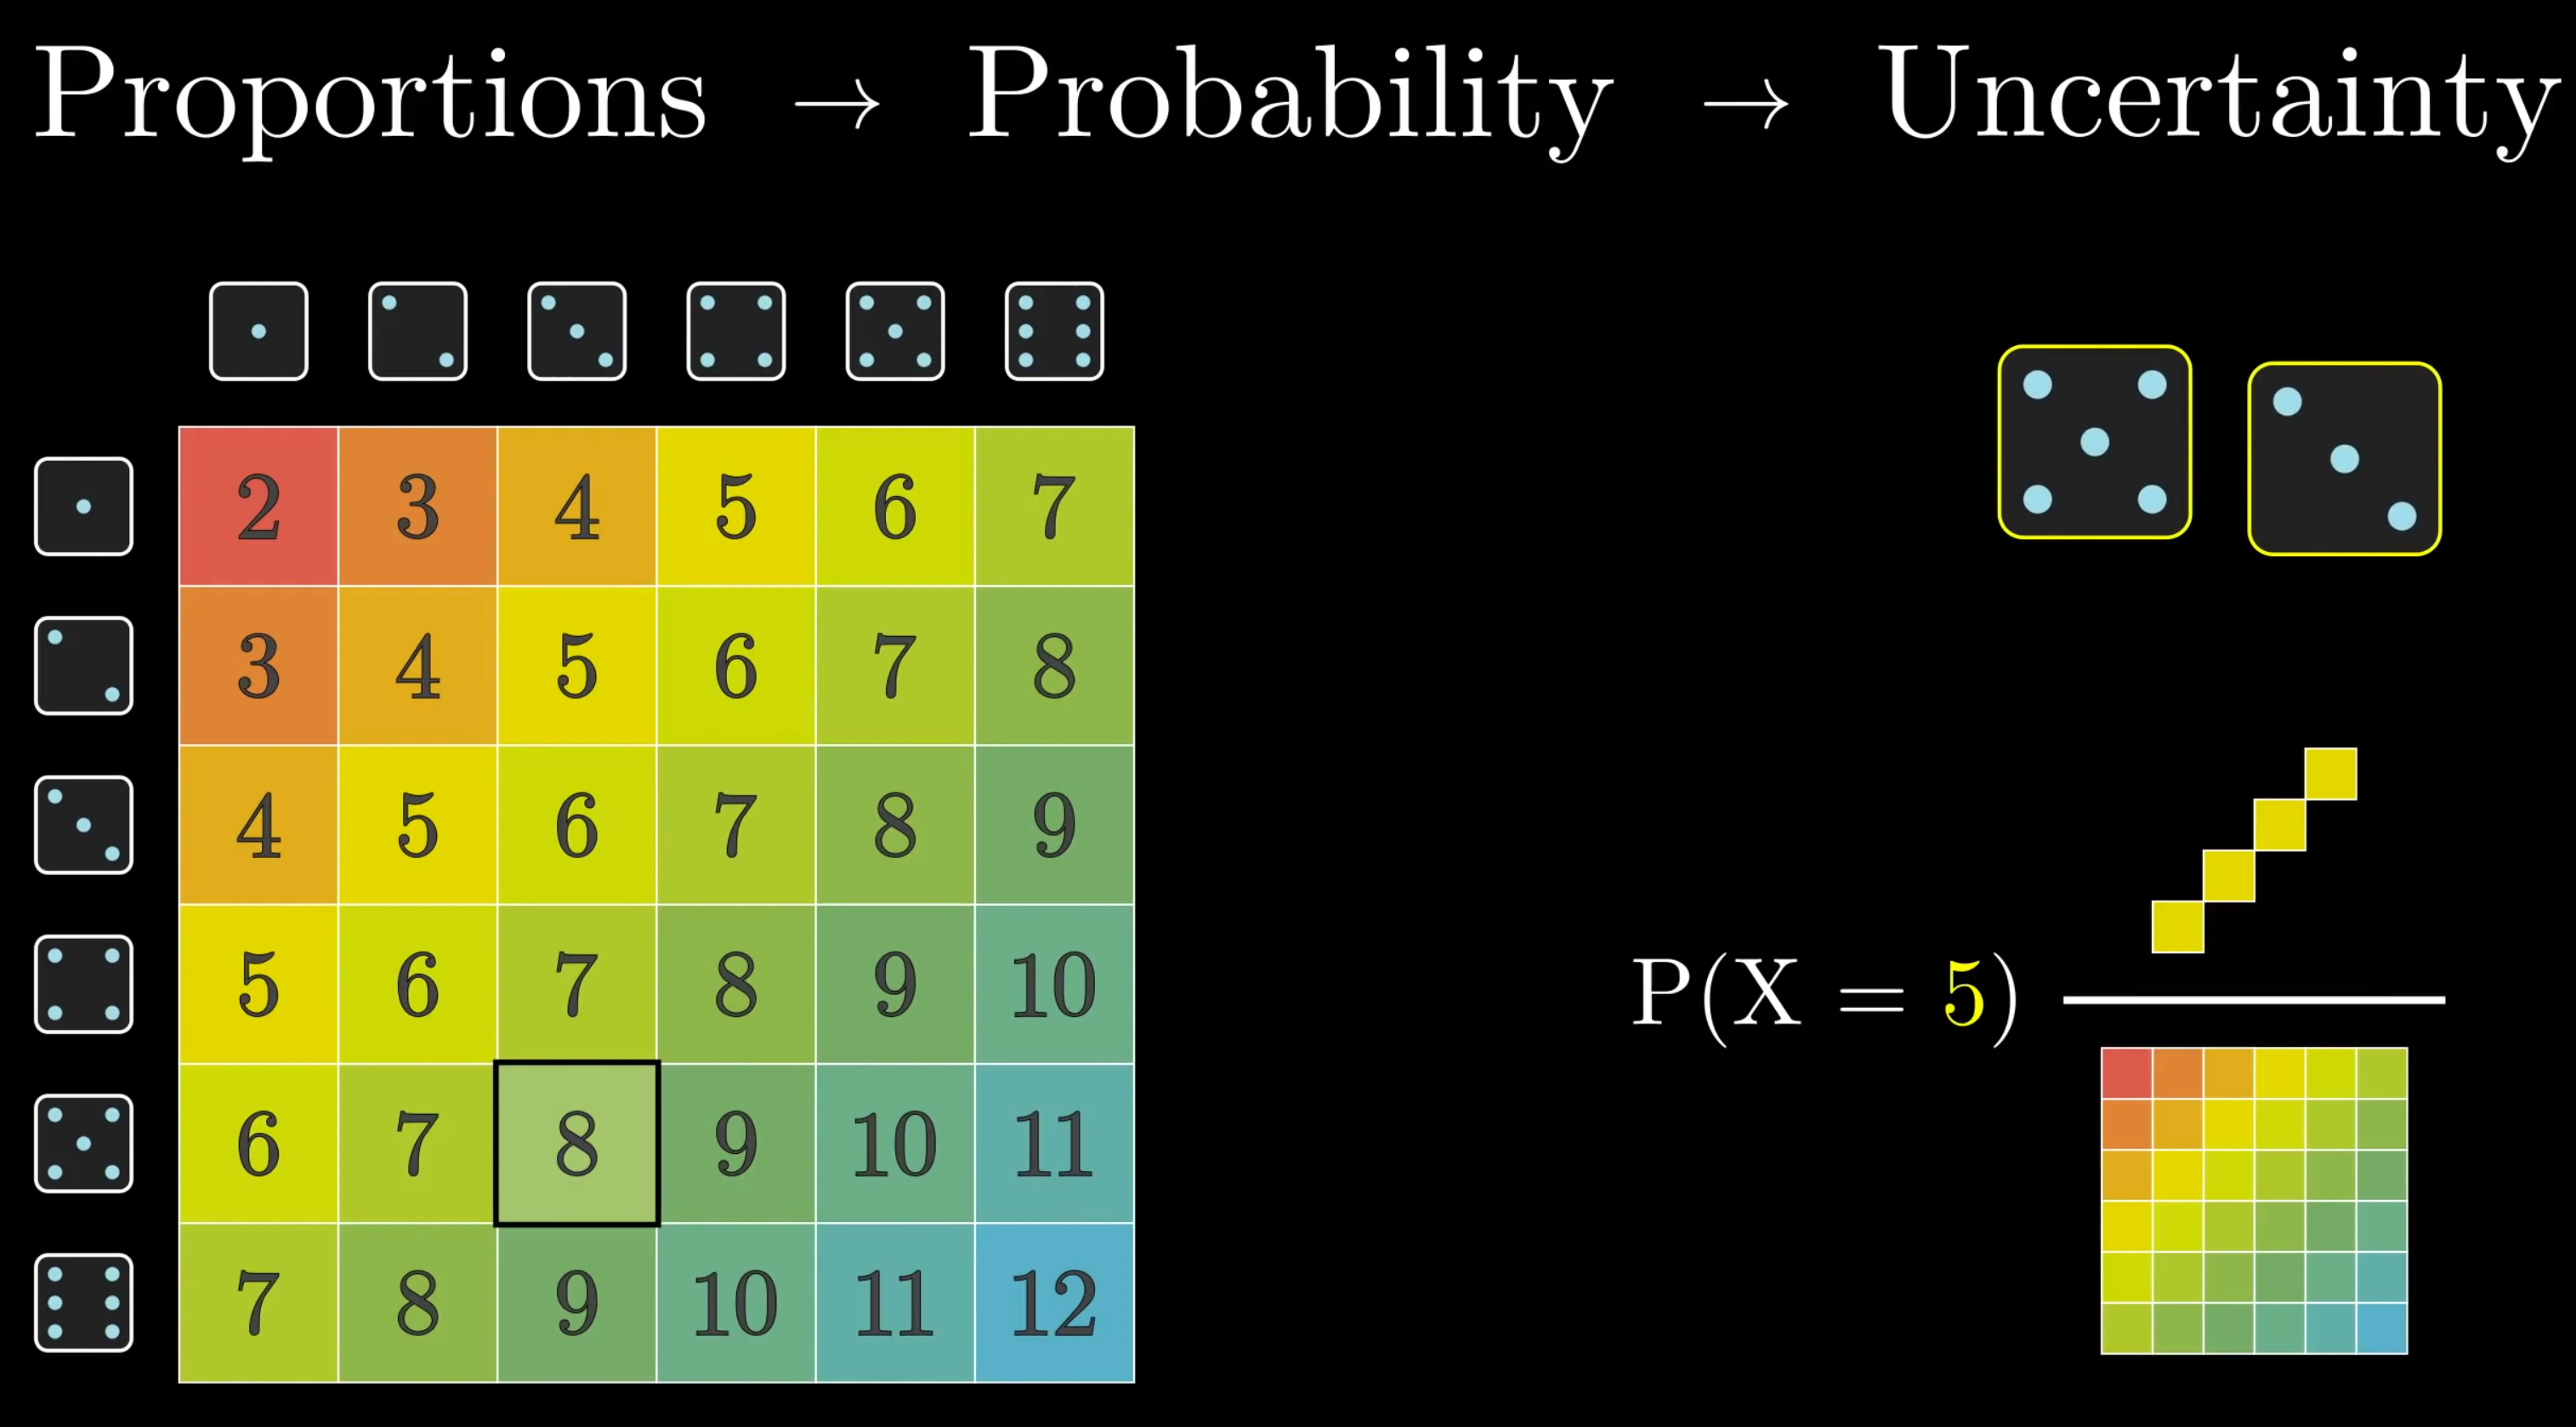
Pictured: The 6×6sample space formed by all possible outcomes when rolling two dice.
The eventX=5, where X is a random variable representing the dice sum can be represented as an area (yellow) in this space, and its probabilityP(X=5) is the proportion of the area of this event to the total area of the sample space → P(X=5)=364=91
Generally, you can think of the sample space as a unit square (area = 1).
Roll two dice. What is the probability that at least one die is a 5?
By tedious counting: Ω={(1,1),(1,2),…,(6,6)} A={(5,1),(5,2),…,(6,5),(6,6)} P(A)=3611
… or we take the problem apart by looking at the complement of A: Either the first die is a 5 or it’s not and the second die is a 5. P(A)=P(X1=5)+P(X1=5)⋅P(X2=5)=61+65⋅61
Visually, it’s easy to see the relation to binomial coefficients (→ probability of getting a 5 on at least one die is the same as the probability of getting a 5 on exactly one die) and how probabilities stack up.
Probabilistic models are not just useful for truly random things, but also for things that are too complex to model exactly.
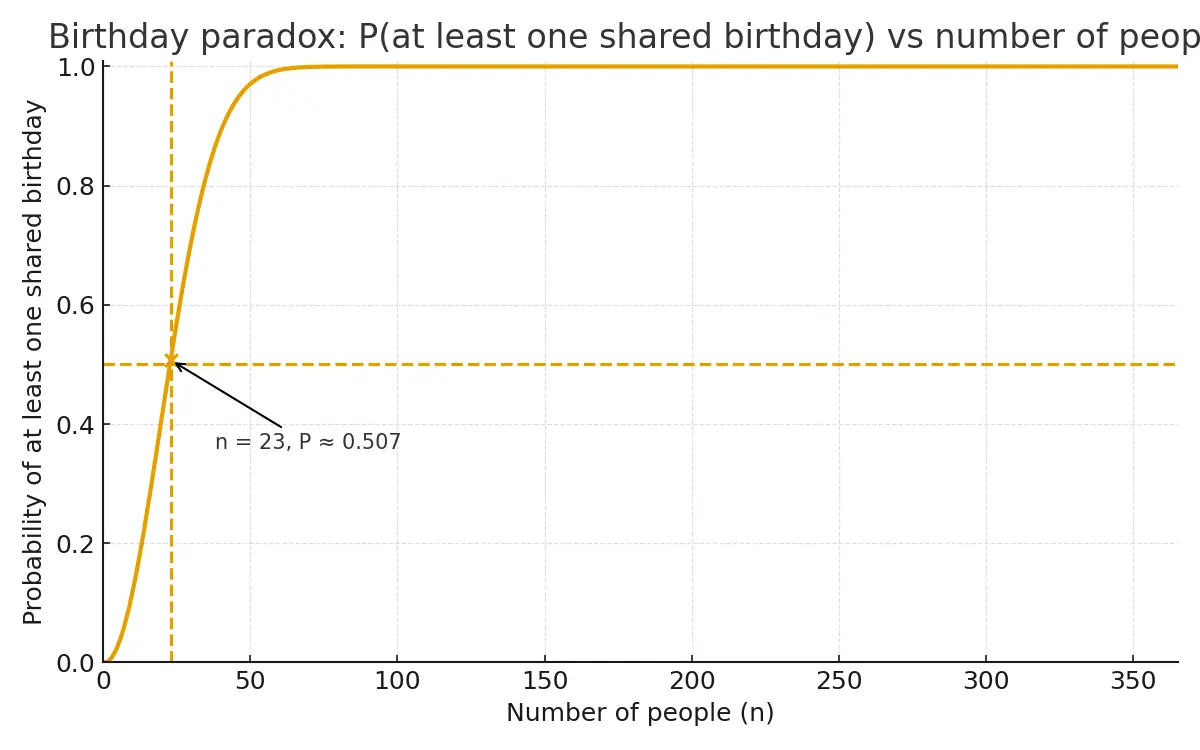
If there are n people in a room, how large does n need to be for at least 50% chance of at least 2 people sharing a birthday?
Each person has to compare with each other person (n−1)+(n−2)+⋯+2+1=2n(n−1), but this won’t help us get to an exact probability, as there’s over-counting, etc. P(x≥2)=1−P(x=0), where x is the number of people with the same birthday.
The expression on the left is very hard to compute as again, you need to keep track of all the combinations, overlaps, …
For the expression on the right (the complement), we just need to divide the number of unique birthdays (sampling without replacement) by the possible number of birthdays (sampling with replacement):
>>> P_different_bday = lambda n: math.prod([(365 - i) / 365 for i in range(1, n)])>>> [round(1 - P_different_bday(i), 3) for i in range(0,10)][0, 0.0, 0.003, 0.008, 0.016, 0.027, 0.04, 0.056, 0.074, 0.095]>>> 1 - P_different_bday(360)1.0
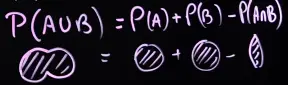
Probability of A or B (at least one) occuring
P(A∪B)=P(A)+P(B)−P(A∩B)
For non-disjoint events A,B∈Ω (i.e. they can co-occur), we need to subtract the intersection, so we don’t count it twice → ∪↔+ (with a correction).
For disjoint events, it simplifies:
Ω … the sample space, the set of all possible outcomes of a random experiment. A,B,C⊆Ω … events. P:F→[0,1] … probability measureP(A) aka Pr(A), aka P(A).
X,Y,Xi … random variables; X=(X1,X2,…,Xd) … a vector of random variables. x,y,z … realized values; x=(x1,x2,…,xd)
PX … the probability distribution “law” of a random variable X. P(y∣x)=P(Y=y∣X=x)P(xi∣y)=P(X=xi,Y=y) … shorthand notation for probabilities of random variables taking on specific values.
p(x)=pX(x) … the probability of a random variableX taking on value x, general notation; specific:
… =P(X=x)PMF (discrete; is a probability)
… =fX(x)PDF (continuous; not a probability, probabilities come from integrals P(a≤X≤b)=∫abfX(x)dx) P(A∣B),p(x∣θ) … conditional probability, discrete and continuous, respectively.
{pθ:θ∈Θ} … a family of distributions indexed by θ.
Its use can depend on context: PMF/PDF:=p(x;θ)=pθ(x)=p(x∣θ) … the probability of data x given fixed parameters θ. (PMF/PDF of x) L(θ;x):=p(x;θ)=pθ(x)=p(x∣θ) … the likelihood of fixed data x given parameters θ. (not a density in θ!)
p(x) … a distribution without explicit parameters, e.g. the true data distribution, or a marginal distribution. p(θ) … a distribution over parameters, e.g. a prior. p(θ∣x) or p(θ;x) … the posterior distribution over parameters given data x.
Wth was the context of this | (Hypergeometric Distribution (sampling without replacement))
give the general form, make the connection to multinomial (sampling with replacement), move into separate form and maybe make a note for sampling with/without replacement
If we have N=NA+NB items, of which a are of type and b are of another type.
Then the probability of sampling n=a+b items, of which a are of type A and b are of type B, without replacement is given by the bivariate hypergeometric distribution:
P(XA=a,XB=b)=(nN)(aA)(bB)
Introduction (old and bad)
Let π(n) denote the nth digit of π.
Consider the quanity (number) of d=π(3).
Is it even or odd? d=4 → even.
What about π(101000)?
There are two approaches to probability:
“d is even with probability 0.5”
Probability: Representing uncertainty about certain values.
Baysian approach. Common in Machine Learning
“d is even with probablility 0 or 1 but I don’t know which”
4. Probability: Mathematically defineable thing about frequencies
5. More common, esp. in rigorous mathematical theory.
Important points:
The total probability is alwys 1
∫Xp(x)dx=1
We care about indepence:
p(x,y)=p(x)⋅p(y)
We care about expectation: The probabiliy times some other function (e.g. darts player points and dart positions)
“ or happened”: